
What Percentage of Putts Do Pros Make? TV Does Not Tell the Story

Written by Graeme Hay | Last Updated: 12/03/2024

Watch the TV coverage of the PGA Tour for any length of time and you would be forgiven for thinking that the top pros hardly ever miss a putt.
Player after player seems to be rolling the ball in from any distance you care to think of and certainly rarely if ever appears to miss the short putts which cause us regular amateurs countless sleepless nights.
But what is the reality when it comes to the percentages of putts that the pros make?
On average PGA Tour pros make 99% of 2-foot putts, 96% of 3-foot putts, 88% of 4-foot putts and 77% of 5-foot putts according to strokes gained pioneer, Mark Broadie. From 10 feet their one putt percentage is 40%, 23% from 15 feet, 15% from 20 feet, 7% from 30 feet, 4% from 40 feet, 3% from 50 feet and 2% from 60 feet.
But hang on a second I hear some of you say, and especially those of you who sometimes keep an eye on the putting statistics on the PGA Tour website.
PGA Tour stats show pros make almost 100% of putts from inside 3 feet.
Well that stat is also true but that’s the per cent of putts they make when the ball is 3 feet or less from the hole. So it includes all the tap ins from right next to the hole in addition to those which are exactly 3 feet away.
To get a better view of how good the pros are at putting from various distances it is a much better idea to see how they get on from specific distances and if you look closely you will find that although they are indeed great putters amateurs by comparison are not that bad at putting themselves.
Putting from inside 10 feet is very different than putting from 10 feet. The PGA Tour average is 88% inside 10 feet, and just 40% from 10 feet. In 1 of 10 rounds tour pros hole 100 percent of their putts from inside 10 feet. https://t.co/qUgY9oOt1a — Mark Broadie (@MarkBroadie) May 1, 2018
Pros Do Not Make As Many Putts As You May Think
The best golf pros in the world playing on the PGA Tour are great putters. There is no question about it.
But if you watch too much golf on TV you may think that they almost never miss a short putt and are regularly rolling in long putts from all over the green.
And as a result you could find yourself expecting to hole most of the 15-foot putts you face on your regular rounds and for certain all of your putts from 10 feet and under because that is what the pros seem to be doing every week.
A closer analysis of the stats of the percentage of putts the pros make from 2 feet all the way to 90 feet, shown in the table below, however will show that they do not hole quite as many as you may think they do.
This data, taken from the official PGA Tour stats and the book ‘Every Shot Counts’ (Amazon link) – written by the pioneer of the ‘strokes gained’ metrics first adopted by the PGA Tour in 2011, Columbia Business School Professor Mark Broadie – highlights clearly the pros do not one putt as often as TV coverage may suggest.
And if you look at a standard 72-hole PGA Tour tournament as a whole you will find that on average pros make only 4.4 putts from over 10 feet and 1.2 putts from over 20 feet per event .
So despite what impression the TV highlights give you that means the best players in the world are only in reality making 1 putt from over 10 feet a round and only 1 putt from 20 feet across the 72 holes of a complete tournament.
So the next time you start giving yourself a hard time for missing that third or fourth 10 to 15 foot putt just remember that the pros would likely have missed them too more often than not.
My buddy: ▶️"Man I had a bunch of 15 footers today that I should have made." Me: ▶️"PGA Tour pros average one made putt per round from 13'3" or longer." #ManageYourExpectations — Lou Stagner (Golf Stat Pro) (@LouStagner) December 18, 2021
[Editor’s note – If you are interested in what putting stats and others are really important to help you improve we would highly recommend the book ‘Every Shot Counts‘ (Amazon link) by Professor Mark Broadie. Check out the review of it here .]
Pros Are Great Putters but Amateurs are Good Too
While all the data shows that the pros do not make as many putts as you may think they are clearly fantastic putters and the best putters in the world.
However traditional golf stats have often proved misleading in explaining why the pros are so much better than regular amateur players.
The old adage of “you drive for show but putt for dough” has been drummed into generations of amateur golfers and allowed the impression to build that it is the short game – chipping and putting – which explains the difference in capability between players.
The reality however – exposed by Professor Broadie and others – is that it is the long game that is more important and that simple fact is almost explained by itself when you look at how many putts the pros average compared to amateurs.
On average PGA Tour pros take 28.92 putts per round according to the official Shotlink data. By comparison typical 90 scoring golfers average 33.4 putts per round but this overstates the skill difference according to strokes gained pioneer, Mark Broadie, because amateur putts typically start further from the hole than pros.
And when you think also that pros are playing on the best putting surfaces in the world it again serves to highlight that putting is not the key thing that explains the mountainous gap in ability between pros and amateur golfers.
After all looking at the average putting stats per round shows it only explains less than 5 strokes of difference between a pros average score and an average 90 scoring golfer and I can’t imagine many regular amateurs accepting close to only 5 strokes for a matchplay game against a PGA Tour pro!
“A 90-golfer will beat a pro in almost 10% of rounds. An 80-golfer’s SGP (Strokes Gained Putting) will beat a pro’s almost 20% of the time. And a scratch golfer will putt better than a pro more than 30% of the time. Amateur golfers aren’t bad putters!” Mark Broadie, Columbia Business School professor and pioneer of the ‘strokes gained’ metrics adopted by the PGA Tour
In his fantastic book, Every Shot Counts, Professor Broadie again details the comparative percentages of how many putts the average 90 golfer makes to let us clearly see amateurs are actually not that bad when it comes to putting even when compared to the pros.
Focus on the Number of 3 Putts Pros Make
When it comes to explaining the difference between the putting of the best putters in the world on the PGA Tour and that of us regular golfers it is best not to focus on the number of putts the pros make but rather on the number of putting mistakes they do not make.
And when we are talking about putting mistakes we are focusing exclusively on the dreaded 3-putt!
Whether you are a professional golfer or a weekend hacker 3-putts are scorecard killers and it is when we come to counting how often pros 3 putt compared to amateurs that we see where the real difference lies.
PGA Tour pros 3-putt only 0.51 times per round according to PGA Tour Shotlink stats. From 5 feet their 3-putt percentage is 0.4%, 0.7% from 10 feet, 1.3% from 15 feet and 2.2% from 20 feet. On longer putts of 30 feet that rises to 5%, 10% from 40 feet, 17% from 50 feet, 23% from 60 feet and 41% from 90 feet.
And the key difference when it comes to comparing the putting of the pros to the average 90 scoring golfer is almost lost when you look at the basic data.
For example if you take a quick look at the average number of putts per hole comparison between a PGA Tour player and an average 90-scoring golfer in the graph below there does not appear to be a lot in it from all distances.

That is true but the crucial thing to look at is when those lines start going over the vital regulation ‘2 putts per hole’ mark on average.
For the 90-scoring amateur the dreaded 3-putts start to happen more often to drive that average up over the regulation at just over 16 feet from the hole while for the PGA Tour pros the average 2-putt range is 35 feet.
Given the PGA Tour pros don’t start ending up further than 35 feet from the hole on average until their approach shots are measuring over 200 yards that just shows how often they will manage to avoid adding those highly damaging 3-putts to their scorecards.
So rather than focusing on the question of how many putts the pros make it is probably better for all recreational golfers to focus on the stat of how often pros 3-putt as it by trying to match them in the latter statistic that will most quickly make a difference in your scores.
Because even for the pros 3-putt avoidance is key compared to one putt success.
Three-wiggles are bad for business. pic.twitter.com/Mjxt9Z2ef6 — Lou Stagner (Golf Stat Pro) (@LouStagner) November 30, 2021
Final Thought
If you are looking to improve your golf, and looking at the stats of the pros for some guidance, it is absolutely vital that you are clear where pros’ gains are coming from and which parts of your game may benefit from you looking more closely at them.
And when it comes to putting if you only do one thing simply stop counting the number of putts you take per round and start counting the number of times you 3-putt instead.
For the average golfer reducing the number of times they three-putt is the quickest way to take strokes off their score and the best way to do that is to reduce the length of your second putt from those all important mid-range distances of 11 to 30 feet.
Speed control is one of the two fundamentals of putting and it is key to helping you to get the ball closer to the hole with that first putt and avoid those damaging 3 putts.
[Editor’s note – If you are interested in finding out the other best golf stats to measure to help you improve your game check our article the 10 best stats to keep track of here .]
[Note – Just so you know, and we are upfront as an affiliate program participant, Golfing Focus, at no cost to you, earns from qualifying purchases made through links on this page.]
Other top articles related to this post:
- What Putters do the Pros Use? Top 100 PGA Tour Player Guide
- How Often Do Pros Hit Driver? Not As Much As You Think!
- Is a Putter Fitting Worth it? It Removes a Variable or Three
- Good Putting Numbers – It’s About 3 Putts Not Putts per Round
- Are Putting Mats Worth it?
- What Is the Best Practice Putting Mat? An Owner of 7 Reviews
- Will Putting Practice on Your Carpet at Home Burn Your Scores?
- Are Putting Lessons Worth It? We Surveyed Over 100 Golfers
- 10 Best Golf Stats to Keep Track of. Start with ‘Major Mistaks’
- Are There Any PGA Tour Pros Without a Hole in One?
- The PGA Tour’s Rising Driver Ball Speeds Mean One Thing – $$
- How Many Balls Do Pros Hit Before a Round? That’s Not the Point!
Leave a Reply Cancel reply
Your email address will not be published. Required fields are marked *
Save my name, email, and website in this browser for the next time I comment.
RECENT ARTICLES

Behind Every Stroke: The Most Popular Putter on Champions Tour (2024)

Champions Hybrid Heroes. Most Used Hybrids by Champions Tour Pros (2024)
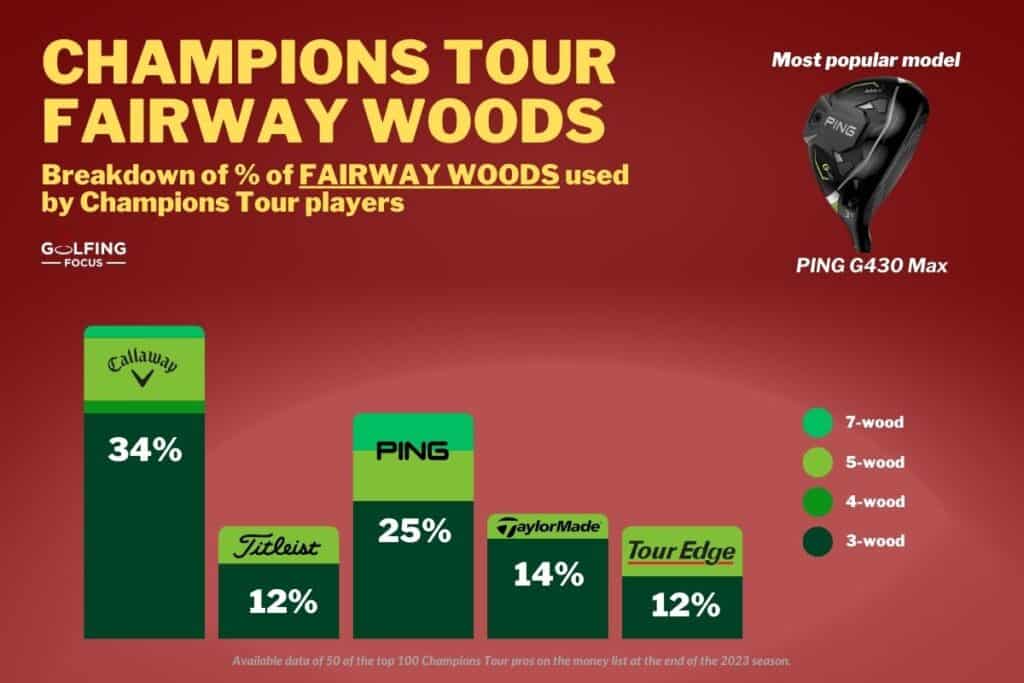
The Go-To Fairway Woods of Senior Tour Champions (2024)
Flexible Friends: Uncovering the Shafts Champions Tour Players Use (2024)
In the Bag: Unpacking the Clubs Champions Tour Players Use (2024)
LEGAL INFORMATION
This site is owned and operated by Golfing Focus Limited, a private limited company whose registered office is in London, UK. Golfing Focus Limited is a participant in the Amazon Services LLC Associates Program, an affiliate advertising program designed to provide a means for sites to earn advertising fees (at no cost to you) by linking to Amazon.com. Golfing Focus Limited also participates in other affiliate programs with the eBay Partner Network, FlexOffers, CJ.com, Svorn and other sites and is compensated for referring traffic and business to these companies (again at no cost to you).
Our Socials
What Percentage Of 10ft Putts Do PGA Tour Pros Make? Clue: It's Not As Many As You Think
Many amateur golfers would fancy their chances over a putt from 10ft, but how many do the pros make on the PGA Tour? We dig into the data to find out...
- Sign up to Golf Monthly Newsletter Newsletter

For anyone who watches the PGA Tour , it may look slightly perplexing how many putts are missed from the 10ft range. Clearly, we aren't able to see the complex nuances of the greens or feel the pressure these players are under, but it does make you wonder... what percentage of 10ft putts do PGA Tour pros make? We analysed the data and were surprised with the findings.
What percentage of 10ft putts do PGA Tour pros make?
Fortunately, the PGA Tour website has a dedicated stats section dedicated to this very metric. Throughout the 2022/2023 season, the average was around 41% - with 91 players falling short of that mark.
One of the more notable names on the list is current World No.1 Scottie Scheffler , who ranked 190th out of 193 players for putting from 10ft. Interestingly, Scheffler made just 25% of his putts, outranking only the performance of Michael Gligic, Doc Redman and Sung Kang that season.

To further amplify the enormity of that stat, the latest Arcoss data revealed that the average tour pro makes 22% of putts from 10-14ft and a 20-handicapper makes 18% from the same distance. While it is difficult to compare the standard and difficulty of the greens, and the magnitude of the measured events, this stat further highlights how challenging this area of the game is for players of all abilities.
Still, with players like Collin Morikawa (31.43%) and Sam Burns (33.3%) making a third or less of all putts from 10ft last season, it clearly isn't just the former Masters champion who struggled from this range. In total, 101 players made the cut to post above average putting numbers from this distance, with only 29 achieving better than 50%.

At the other end of the stats table, 2023 US Ryder Cup Captain Zach Johnson led the way after making a staggering 69% of his putts. The top of the list is a who's-who of putting brilliance, with the likes of Denny McCarthy, Rickie Fowler , Webb Simpson and Patrick Cantlay securing their place in the top-5 for this measure.
Get the Golf Monthly Newsletter
Subscribe to the Golf Monthly newsletter to stay up to date with all the latest tour news, equipment news, reviews, head-to-heads and buyer’s guides from our team of experienced experts.
Barry Plummer is our Staff Writer, joining in January 2024 after seven years as a PE Teacher. He now writes about instruction, working closely with Golf Monthly's Top 50 Coaches to provide hints and tips about all aspects of the game. As someone who came into golf at a later age, Barry is very passionate about supporting the growth of the game and creating opportunities for everyone to access it. A member at Sand Moor Golf Club in Leeds, he looks forward to getting out on the course at least once a week and making up for lost time in the pursuit of a respectable handicap.
Barry is currently playing:
Driver: Ping G425
Hybrid: TaylorMade Stealth 4 Hybrid
Irons: Mizuno JPX 921 4-PW
Wedges: TaylorMade RAC 60, Callaway Jaws MD5 54
Putter: TaylorMade Spider Tour

The Swede has withdrawn from the Quail Hollow event to allow additional rest before the PGA Championship
By Mike Hall Published 6 May 24

Career amateur Stewart Hagestad has made it back to Augusta National after another US Mid-Am victory
By Elliott Heath Published 6 May 24

Spending two hours watching the leading groups come through the heart of Amen Corner, here's everything I learned about the championship defining stretch of golf
By Dan Parker Published 14 April 24

While the ten shot difference tells one story, watching them side by side gave me a deeper insight into why Rory is so far off it
By Dan Parker Published 13 April 24

From the hills to the queues to the smell, here are the five things I've learned about the Masters on my first visit
By Dan Parker Published 12 April 24

With the world of professional golf in such a fractured state, the Masters Par 3 Contest reminded me why I love golf
By Dan Parker Published 10 April 24

Golf clubs are making strides to bring equality to the game, but many are still stuck in the Jurassic period or moonlighting and getting away with it
By Katie Dawkins Published 25 March 24

Even the best golf shoes wear over time. Here's the five signs it's time you invested in a new pair
By Dan Parker Published 19 March 24

The PGA Tour is entering arguably the most crucial period of its entire existence. The organisation has some huge decisions to make over the next few months...
By Nick Bonfield Published 12 March 24

There have been plenty of famously gutsy performances by golfers who are injured, but why might this help them to play better golf?
By Barry Plummer Published 12 March 24
- Contact Future's experts
- Terms and conditions
- Privacy policy
- Accessibility statement
- Cookies policy
- Advertise with us
Golf Monthly is part of Future plc, an international media group and leading digital publisher. Visit our corporate site . © Future Publishing Limited Quay House, The Ambury, Bath BA1 1UA. All rights reserved. England and Wales company registration number 2008885.

Golf Science – Putting Numbers that Might Surprise You

The one golf shot everyone can make, and make successfully, is, of course, the putt. As the putter never rises very far from the ground, all a golfer needs to do is make a small movement back and a small movement through, and plonk, the ball is in the hole!
Perhaps that is why golfers, from rank beginners to the best of the professionals, feel and look very, very disappointed when they miss the hole by a thread. One case in point is Jordan Spieth, who looks disappointed whenever he misses any putt at all, even a long, sidehill, downhill putt.
While putts-missed frustration is based on golfers’ expectations, the reality of what they should expect is quite different. What, really, are the odds of making a putt?
According to research by Mark Broadie, a professor at Columbia University who is responsible for the ‘strokes gained” concept, on average PGA TOUR pros make 99% of 2-foot putts, 96% of 3-foot putts, 88% of 4-foot putts and 77% of 5-foot putts.
From 10 feet, the pros’ one-putt percentage is 40%, 23% from 15 feet, 15% from 20 feet, 7% from 30 feet, 4% from 40 feet, 3% from 50 feet and 2% from 60 feet. Also, according to Broadie, putting from inside 10 feet is very different than putting from 10 feet. The PGA TOUR average is 88% inside 10 feet, and just 40% from 10 feet. Only in one of 10 rounds do tour pros hole 100 percent of their putts from inside 10 feet.
And most recently, in 2021/22, Tour pros made an average 99% of putts that were 3ft or less. The number dropped slightly for 4ft putts, to 92%, while 81% of 5ft putts were successful, and 70% of 6ft putts were holed. That falls to around 61% of 7ft putts, 54% of 8ft putts and 45% from 9 feet.

So what should an average golfer do to improve their odds of holing more putts? The main difference comes from more practice. Good practice, naturally. Golfers should not just practice short putts but long putts, too – those that are often referred to as “lag” putts. In general, to improve putting, it is easier and makes more sense to reduce the number of three putts than to increase the number of single putts.
The three aspects to good putting are – a good and repeating stroke, good distance control and good direction judgment or green-reading skills.
Information abounds about how to read greens, from plumb-bobbing (which Dave Pelz of Putting Bible says does not work) to using AimPoint concepts to understand slope on a putt.
With respect to the stroke itself, the main requirements are for putter-ball contact to be centered, with a square face, no deceleration through impact and a slight rise angle (club face moving upwards by about 2° or so). This is something that a golfer must work to improve, and there are two camps with regard to the best stroke to deliver consistent results – an in-to-out-to-in stroke or a straight back and through one. Ideally, golfers should experiment with a couple of styles (as recommended by famous putting gurus like Dave Pelz, Geoff Magnum and Craig Farnsworth).
The concept of speed or distance control is perhaps the most important and yet one that can only be learned from practice, which would improve hand-eye coordination. There are many phrases that tell golfers to never leave a putt short, such as “never over never in,” but how to know how hard and how fast to hit a putt?
Literally, the only thing that can improve this most important aspect of putting is putting in the reps. And making sure the stroke is a repeating one.
One very comforting point that Dave Pelz makes is that great putters are made, not born. Of the 15 aspects or building blocks that he believes matter for the execution of good putts, he says that most golfers are usually good at many of them. The 15 aspects (building blocks) that together result in good putting, are aim, path, touch, rhythm, ritual, feel, face angle, stability, attitude, routine, putter fitting, power source, impact pattern, flow lines and green-reading.
Pelz also says that putting is both an art and a science. So, golfers, the best way to improve your putting – the one part of everyone’s game that can be on par with everyone else’s – is by … putting!
Enter search term or phrase
Share: golf science – putting numbers that might surprise you.
Please complete the below form. All fields are required .
Who Should We Send This To?
- Recipient Email Address: *
And Who Are You?
- Your Name: *
- Your Email Address: *
- Comments This field is for validation purposes and should be left unchanged.
Stay Connected!
- First Name *
- Last Name *
- Market Atlanta Dallas/Fort Worth Hill Country Kansas City Phoenix
Subscribe Form
The CJ Cup Byron Nelson
TPC Craig Ranch
Look deeper
Scottie Scheffler leads the PGA Tour in this putting stat. Here’s what it does and doesn’t reveal

Gregory Shamus
Wait, that doesn’t sound right . Even if you’re a casual golf fan, you’re likely aware of Scottie Scheffler’s struggles on the greens this year and wondering if we have a typo in the headline. During a season in which he leads the PGA Tour in numerous ball-striking categories, the World No. 1 has been dreadful with the putter, ranking outside the top 145 in strokes gained/putting.
With two wins and 13 top-five finishes, Scheffler has had a fantastic season, but it’s hard not to consider how historic his season would have been with just average putting stats ( we recently crunched the numbers, and you can find that here ). But even with Scheffler’s troubles on the greens (he ranks outside the top 150 in numerous other putting categories), there is one statistic he leads: approach putt performance.
Normally a helpful stat to judge distance control on the greens, approach putt performance measures how close a player leaves his first putt from the hole on average. This season, no one is better than Scheffler and Ryan Armour, who both average 1’11” for their second putts. As you’d imagine, there is correlation between leaving your first putt close to the hole and avoiding three-putts. It’s little surprise then, that Scheffler is ranked 11th in three-putt avoidance.
RELATED: The tour's best short-range putter has some good advice for the rest of us
How can Scheffler have some of the best speed control on tour and be avoiding three-putts but still be near the bottom in numerous major putting categories? What this disparity does and doesn’t reveal is insight for all of us into how we should examine our own games.
What it does reveal
Scheffler leading the tour in approach putt performance says more about his excellent ball-striking than his touch on the greens. This statistic, like many others, cannot be viewed in a vacuum. Scheffler leaves his first putts closer to the hole than any player, but of course not everyone is hitting their first putts from the same distance from the hole.
In addition to leading in strokes gained/approach and greens in regulation, Scheffler is among the best on tour in proximity to the hole. From the fairway, he ranks a solid 21st in proximity, and from the rough he is 13th on tour. Within 30 yards of the green, only three players average closer to the hole. Taken together, Scheffler is hitting his first putts from significantly closer to the hole than most players.

RELATED: At what yardage could you shoot even par? The answer might surprise you
What it doesn't reveal
Unfortunately for Scheffler, his high ranks in approach putt performance and three-putt avoidance don’t say much about his overall putting. His make percentages from 20-25’ (150th), 10-15’ (166th), and 4-8’ (169th) are near the bottom of the tour. Yes, he is leaving his second putts close to the hole, but 1) he is hitting his first putts from closer on average and 2) he is holing far less short- and mid-range putts than most players.
The takeaway
The takeaway for the rest of our games is to be careful in placing too much emphasis on certain stats without thinking about what other factors could be influencing the numbers. A couple good examples are total putts per round and scrambling percentage. As much as it may seem diligent to track these stats at the bottom of your scorecard, they reveal very little on their own.

Karl Hendon
Let’s say two players have 30 putts in a round—a seemingly decent number. Suppose one player struck it very well and hit 16 of 18 greens, leaving an average first putt of 35 feet. The other player hit just four greens, but on the 14 times they were chipping from around the green, they left themselves with an average putt of 15 feet. Both players had 30 putts, but the player who hit 16 greens had a much better putting day considering their proximity was much farther. If you’re going to track your total putts per round, be sure to consider your greens in regulation and how close you were putting from.
There’s a similar idea with measuring how many times you get up-and-down in a round. A high scrambling percentage on a given day suggests you were chipping and putting well. But which one was it? Sure, you could have done both well, but if you were chipping it to three feet all day, that says far less about your putting than it does your touch around the greens. Or maybe you were knocking in 20-foot par-savers all day. You were getting up-and-down, but you weren’t necessarily chipping well.
Remember, many statistics cannot be viewed in a vacuum. Tracking them is key to understanding your game so you know where you need to improve, but be sure to consider what other factors could be affecting a given stat.
More from Golf Digest
Trending now.
- Open a Golf Center
- Indoor Golf Revenue Calculator
- Golf-simulator-cost
- Golf Simulator Design
- StartupChecklist
- Free Business Plan
- Location Selection
- Home Systems
- Golf Sim Plans
- Best Golf Simulator Software
- Outdoor Golf Simulators
- Golf Hitting Mats
- 10 Best Golf Simulator Projectors
- Best Golf Nets
- 10 Best Indoor Putting Greens
- Golf Simulator Impact Screens and Enclosures
- GSPro vs E6 Connect
- Motorized Push Carts
- Best Golf Rangefinders
- Best Lightweight Golf Bags
- Golf Bags with Full Length Dividers
- Best Golf Travel Bags
- Golf Shoe Bags
- 7 Top Golf Cart Speakers
- 8 Top Golf Cart Coolers
- Golf Accessories
- Golf Simulators
- Golf Training Aids
- How To Articles
Are the PGA Tour Putting Statistics Misleading

- 2018: Dustin Johnson and Phil Michelson, both with an average of 1.699 putts per green in regulation (GIR).
- 2019: Jordan Spieth, with an average of 1.694 putts per GIR.
- 2020: Webb Simpson, with an average of 1.691 putts per GIR.
- 2021: Cam Smith, with an average of 1.689 putts per GIR.
- 2022: Cam Smith, with an average of 1.679 putts per GIR.
- 2023: Christiaan Bezuidenhout, averaging 1.63 putts per GIR.

PGA Tour Putting Stats

Key Factors Affecting PGA Tour Putting Stats
- Green speed
- Weather conditions
- Putting surface (e.g., Bermuda grass, bentgrass, etc.)
- Putting technique
- Mental focus and confidence
- Number of holes played
- Approach distance
The Strange Case of Left-to-Right Putts

Putt Average
Pga tour putting stats by distance, pga tour putting stats from 10 feet, pga putting stats 2023, stroked gained putting pga tour, pga tour putting stats per round.
Search Golf Compendium
Golf compendium, yearly pga tour putting leaders (including strokes gained).

Annual Strokes Gained Putting Leaders on PGA Tour
Putts per round leaders on the pga tour, putts per gir leaders on the pga tour, popular posts from this blog, golfers with the most wins in major championships, 2024 masters tournament winner and final scores.

24 Famous Golfers Who Were Photographed in the Nude
Instruction
Research shows golfers should spend more time practicing short putts.
Putting is an important 40 percent of the game at virtually every level of play. In 2016, the average PGA Tour player needed 29 putts to shoot their average score of 70.85 (41 percent of their strokes). The average 17-handicap golfer needs 34 putts to achieve their average score of 89 (38 percent).
Clearly, not many of us have the physical skill to drive the ball like a Tour player, but almost anyone can putt like a Tour player with the right equipment, technique and practice. There’s been a lot written on the equipment and techniques golfers should use to putt better. What’s not talked about as much is how golfers should practice putting… and from what distances?
For the answer, I studied our ShotByShot.com database recorded at a 17 Slope Adjusted Differential (this was the 12,000-plus rounds when the golfers actually played exactly to their 17 handicap). I had a stronger motive for this research than writing this article. We have added a new product to our ShotByShot.com Strokes Gained analysis: a putting skills test and practice app. Our goal is to provide an additional, simple but intelligent application to accurately test putting skill and focus practice time for meaningful improvement.
Through our research, we learned that a 17-handicap male golfer’s average round includes the following.
Long Game: Only 4.7 GIRs with an average putting distance of 26 feet on these successful GIR’s.
Short Game (shots within 50 yards of the hole):
- 10 chip/pitch shots, successfully hits eight on the green (two errors or missed greens) to an average putting distance of 14 feet.
- Two sand shots. When he successfully hits the green (only 68 percent of his sand attempts), his average putting distance is 17 feet.
Putting (34 total putts including):
- 1-Putts = 3.7
- 2-Putts = 11.8
- 3-Putts = 2.25
- 4-Putts = once in every 20 rounds.
50 Percent Make Distance : The distance from which he will make 50 percent of his putting opportunities is 5 feet . By comparison, the PGA Tour player’s 50 percent make distance is 8 feet.
2-Putt Range : The distance from which he will average 2 putts is 16 feet . This means that outside of 16 feet, our 17 handicap will 3-putt with a greater frequency than 1-putt. The PGA Tour’s 2.0 distance is 34 feet.
I used the data above along with the array of putting opportunities below (first, second and thirds putts) in combination with the putting performance from each distance to project recommended practice. As you can see below, 68 percent of the average golfer’s putting opportunities fall from 15 feet and closer and 41 percent from 5 feet and in.

The chart below displays our average 17 handicaper’s 1-putt and 3-putt percentages by distance range.

Finally, I charted the 1-putt percentages from 3-10 feet for the average 17- and 10-handicap golfers.

Practice Recommendations
- Time? Putting is worth 40 percent of the time you are willing to devote to your golf practice.
- 70 percent of your practice putting time should be devoted to increasing your 1-putt percentages on short putts and extending your 50 percent make distance.
- 30 percent of your putting practice time should be spent improving your distance control on lag putts in the 20-50 foot ranges and extending your two-putt distance.
Short Putts: Star Drill

Distance Control: Lag Putts
Place a tee 20 feet from a target or hole. Use two or three balls and practice lagging them back and forth until you can consistently get the balls to the target, but no farther than 2 feet past the hole. Repeat the drill from 30 and 40 feet trying to leave the putts no farther than 3 feet from the target.
You can test your putting skill and record your practice at www.shotbyshot.com .
How to Control Your Wrists Through Impact
Save Your Wrists, Kill That Slice!

In 1989, Peter Sanders founded Golf Research Associates, LP, creating what is now referred to as Strokes Gained Analysis. His goal was to design and market a new standard of statistically based performance analysis programs using proprietary computer models. A departure from “traditional stats,” the program provided analysis with answers, supported by comparative data. In 2006, the company’s website, ShotByShot.com, was launched. It provides interactive, Strokes Gained analysis for individual golfers and more than 150 instructors and coaches that use the program to build and monitor their player groups. Peter has written, or contributed to, more than 60 articles in major golf publications including Golf Digest, Golf Magazine and Golf for Women. From 2007 through 2013, Peter was an exclusive contributor and Professional Advisor to Golf Digest and GolfDigest.com. Peter also works with PGA Tour players and their coaches to interpret the often confusing ShotLink data. Zach Johnson has been a client for nearly five years. More recently, Peter has teamed up with Smylie Kaufman’s swing coach, Tony Ruggiero, to help guide Smylie’s fast-rising career.
43 Comments
Pingback: How to Effectively Use Your Golf Practice Time | High Golf Handicap
Dec 30, 2017 at 11:20 am
If you’re talking inside the “Circle of Friendship”, that’s good
hoa tuoi dep
That was very accurate for me. Thanks for the reminder!
tamloplaysang
Oct 16, 2017 at 1:25 pm
thank for sharings
dichvuvietbaiseo
Oct 12, 2017 at 12:39 am
Thank you very much
chothuemayphotocopy.info
Oct 1, 2017 at 12:06 am
Woow thank you very much. Very good is infomation.
thuemayphoto.info
Sep 15, 2017 at 5:22 am
Thank yo very much. it’s the good information
Jul 26, 2017 at 1:57 am
thanks for sharing posts hack like facebook in my website: https://auto-bot.me/
Jul 12, 2017 at 1:28 pm
Great article. I’ve always shot between 81-86, with the occasional trip into the high 70’s if I get the opportunity to play more. I ended up breaking my 3, 5, and 7 iron and never got them fixed. It may seem obvious, but when I came back from a long layoff, not having those clubs in my bag had almost zero impact on my scores. This just made me realize even more definitively that I need to work on my approach shots and putting if I want my scores to improve
linh vat phong thuy
Jul 6, 2017 at 6:41 am
A departure from “traditional stats,” the program provided analysis with answers, supported by comparative data.
boc rang su tham my
Jun 7, 2017 at 5:03 am
If you’re talking inside the “Circle of Friendship”, that’s good, pick it up.
Jun 1, 2017 at 5:06 am
B?O V? S?C KH?E http://suckhoe2t.net/phong-kham-da-khoa-3-thang-2-co-tot-va-uy-tin-khong/
May 21, 2017 at 10:48 pm
Great article with the stats to show comparisons 🙂
sharemagiamgia
Apr 27, 2017 at 4:55 am
Good article with the stats to show comparisons.
nam giam can
Apr 24, 2017 at 10:04 am
Golf is a sport for the nobility
vach ngan ve sinh chong am
Apr 21, 2017 at 5:17 pm
So I ageee with the writer that working on lag putting and short putts in combination makes a lot of sense.
tien dola am phu
Apr 5, 2017 at 11:51 am
Differential (this was the 12,000-plus rounds when the golfers actually played exactly to their 17 handicap). I had a stronger motive for this research than writing this article. We have added a new product to our ShotByShot.com Strokes Gained analysis: a putting skills test and practice app. Our goal is to provide an additional, simple but intelligent application to accurately test putting skill and focus practice time for meaningful improvement.
giaphatland.vn/properties/ban-can-ho-chung-cu-sensation-thao-dien-quan-2
Apr 3, 2017 at 9:54 pm
I’d ask myself why I’m so far away from the hole so frequently when I’m not on the green in regulation. Bad short game. The 17 capper probably puts it in the 6-10 foot range while chipping on his “good” chips. A great chip gets within 3 feet, and a bad one is probably 15+ feet. Why would he spend a ton of time on those 8 footers instead of working on getting closer to the hole? If your good chips turn into 3-5 footers, your great chips are now kick-ins, and your bad ones are now 10-15 feet away, you’re going to start making more putts without even having to make more 8 footers based on the fact that you’re now closer to the hole the majority of the time. Then he can work on those 8 footers after he starts improving his short game.
giaphatland.vn/ban-can-ho-chung-cu-millennium-ben-van-don-quan-4
Apr 3, 2017 at 6:24 am
Again, I’m not saying that working on your putting is a bad idea by any means; pretty much everyone should do it more than they do. Obviously making more 8-footers is a great thing for anybody’s game, but that definitely wouldn’t be my go-to for this type of player. Unless he’s going to start hitting more greens in regulation (then he’d need more help lag putting most likely), he’d be much better served working on getting his average short game shot down from that 14 foot distance. He’ll likely drop significantly more strokes doing that than making 20% more of his 8 footers.
Mar 16, 2017 at 2:06 pm
Great article. I’ve always shot between 81-86, with the occasional trip into the high 70’s if I get the opportunity to play more. I ended up breaking my 3, 5, and 7 iron and never got them fixed. It may seem obvious, but when I came back from a long layoff, not having those clubs in my bag had almost zero impact on my scores. This just made me realize even more definitively that I need to work on my approach shots and putting if I want my scores to improve.
http://hoclaixenang.edu.vn/
Mar 14, 2017 at 1:42 pm
This is really necessary for the goft player. This information is useful to me. Thank You!
Mar 11, 2017 at 8:54 pm
In other news….water is wet
Mar 11, 2017 at 11:53 am
I love the star drilled. I was taught that when I was in college and still use it religiously. I usually try to make 15 before I move a foot back. I’ll start with 3 balls at 3 feet and after I make 15 straight, I’ll go back a foot. Another drill I think is really good is the 3,6,9 drill. Place tees at 3, 6, and 9 feet and the goal is to make three in a row before moving to the next tee. In college we used 10 balls and had to make 10/10 at 3 feet, 8/10 from 6 feet and 6/10 from 9 feet. I saw the new method on one of the golf channel academies with Jim furyk. Once you practice these drills, there won’t be as much pressure on your chipping. These are few additional drills but for a scratch golfer I still do them every time I practice my putting.
Mar 11, 2017 at 10:33 am
In other news, studies show apples are good for your health and should eat more of them….
Mar 11, 2017 at 8:04 am
I do the “cross” drill where I put balls every 18″ or so out to about 5′ (3-4 balls) and I have to make every one before I rotate 90 degrees and do it from side. I like it because you’re going to make ~100% of your first putt and it’s helpful to see the ball go in the hole.
Radim Pavlicek
Mar 11, 2017 at 4:57 am
Excellent, now I would like to see 6hcp and scratch.
Peter Sanders
Mar 12, 2017 at 11:51 am
Thanks Radim, All the comparative data is part of the program: shotbyshot.com
http://haiminhco.com.vn
Mar 10, 2017 at 10:24 pm
V?i nhi?u chính sách ?u ?ãi h? tr? ng??i dùng. Nhi?u dòng s?n ph?m máy photocopy ?ã cho ra m?t r?t nhi?u dòng máy có ch?c n?ng t?t c?ng nh? hi?n ??i nh?t. Ph?c v? m?c ?ích s? d?ng c?a ng??i dùng
Kelvin Kelley
Mar 10, 2017 at 9:25 pm
Mar 10, 2017 at 3:54 pm
Um, no kidding. As most weekend golfers just show up swing a couple of times and tee off this isn’t exactly ground breaking news. That said I’ve noticed practicing my putting over the past few years has really paid off along with practicing chipping as well. As more than half your shots are around the green it only makes sense over just bashing your driver anyway.
Mar 10, 2017 at 2:04 pm
If you’re talking inside the “Circle of Friendship”, that’s good, pick it up.
Mar 10, 2017 at 12:43 pm
The concept is simple to understand, but most of all it worked well for me. I bought one of those Butch Harmon Inside Down the Line putting tracks (I believe this is the method he taught Tiger Woods years ago as Tiger and Butch have both referred to it later in publications after I bought it to confirm it’s legit value for training to me). I used that nightly down my basement putting from 4-10 feet and often hitting up to 60-70 putts at night… plus at the course on a practice green too. I saw my putting stats drop by about 5 strokes on average, which obviously translated to lowering my hcp. I found the lag putting practice wasn’t as necessary as I once thought since my confidence to hit 4 and 5 footers after a mediocre lag putt helped save an extra stroke on that green. As they say, there’s never a bad first putt when you make the second… unless you miss a gimme I suppose!
Mar 10, 2017 at 12:06 pm
This is news to me?
N. D. Boondocks
Mar 10, 2017 at 11:37 am
Maybe it’s just my home course, but I’d be seriously angering a lot of other golfers also trying to use the practice green if I used that putting drill.
Mar 10, 2017 at 11:20 am
Maybe I’m missing something, but to me, it looks like research shows that golfers need to work on their short game and lag putting more than their short putts…
If the player is 3-putting from 30ft, I’d argue that it’s not really because he missed a 5-10 footer for his 2-putt; it’s because he left himself a 10 footer for his second putt instead of a tap-in to begin with.
Mar 10, 2017 at 11:42 am
Agreed. Using Game Golf, I’ve learned that my best scores come when my short game is dialed and my putting average changes very little. Using Game Golf’s Strokes Gained feature vs. Scratch for example, my best round (78) showed that I was 1.25 strokes worse off the tee, 2.12 strokes worse on approach, 2.65 worse on short game, and 2.29 worse on putting. My best round so far in 2017 (88) on the other hand has me at 1.1 worse off the tee, 4.61 worse on approach, 9.75 worse on short game, and 2.34 worse on putting. I’m generally a good lag putter, and have made several putts outside of 10′ even 15′ from a variety of slopes and lies. I’d be much closer to a single-digit handicap if I put more work in on my short game.
Mar 10, 2017 at 12:35 pm
you may do better to track this one stat – http://www.golfwrx.com/285949/the-truth-behind-greens-in-regulation-and-scoring/
Mar 10, 2017 at 4:16 pm
I remember that one. That was very accurate for me. Thanks for the reminder!
Mar 11, 2017 at 9:39 am
I missed that one somehow. That is interesting. You kind of have to work backwards – and honestly if you’re trying to break 80 or 70 you need all aspects of your game working right?
But if I need to hit at least 7 gir to break 80 (on average) that probably means I need to hit 6-7 fairways and you figure you’ll hit 1-3 of the par 3 greens. I don’t know what percentage of greens are hit from the fairway but if you’re in the trees all the time I’m guessing your percentage of GIR go way down.
But to me even if GIR is a key stat – you’re going to be 30-40 feet away so lag putting is very important. And if you scramble 11 times a round making five footers is also really important.
Mar 11, 2017 at 10:57 am
Ian, I agree that GIR’s is the best of all the old, traditional, 1-dimensional stats. It signifies 2 positives: 1. One’s game has been efficient enough to get there and 2. It is always a birdie putt of some length. The problem with GIR’s is also two fold: 1. The avg. golfer hits less than 5 per round and 2. It provides no answers as to the cause of all the NON-GIR’s.
Mar 11, 2017 at 10:52 am
TR1PTIK, Please correct me if I am wrong but isn’t Game Golf analyzing your putting based upon # of putts? GPS is only accurate to about 8 meters (25 feet) so the GPS systems cannot get short game or putting distances. Putting analysis based upon # of putts is as accurate as balancing one’s checkbook based solely upon the # of checks written.
I think the argument is saying the golfer in this example has very few 30 ft putts anyway, so being able to 1 putt from 8 feet rather than 2 putt is a gamechanger.
Mar 11, 2017 at 12:39 am
Well yah, making more putts is obviously a good thing. But how much improvement can you realistically expect? Even the best players in the world are only making around 50% of putts from 8ft… The graph above shows the 17 capper making about 30% of putts from that distance. So even if he becomes as good as a professional from 8ft, which is extremely unlikely no matter how much he practices because he probably plays on muni greens, then he MIGHT pick up a couple strokes per round. Wouldn’t he be better off figuring out why he’s around 8+ft from the hole so frequently, especially when he’s only hitting 4-5 greens in regulation?
If I’m a 17 capper looking at the statistics and see that a pro is only taking 5 less putts per round than me despite shooting 17 strokes lower on average, I’m not thinking, “Oh, he must be making more 8 footers than me.” First, I’d realize that the pro is hitting SIGNIFICANTLY more greens than me, hence the reason he’s only taking 5 less putts per round (2-putts aren’t a bad thing if you’re on the green in regulation). So the obvious solution would be to hit more greens in regulation. Obviously that’s not the world’s easiest task, especially for a 17 capper. So assuming that won’t change much, what’s an easier way to lower my putt total (and total score)?
1) The player in this example is averaging 2.25 3-putts per round. Unless he’s playing on some REALLY difficult greens, he’s not a very good lag putter. A realistic goal would be to try to get that down to 1 3-putt per round. There’s a shot off your score, and you don’t have to make an extra 8 footer to do it.
2) I’d ask myself why I’m so far away from the hole so frequently when I’m not on the green in regulation. Bad short game. The 17 capper probably puts it in the 6-10 foot range while chipping on his “good” chips. A great chip gets within 3 feet, and a bad one is probably 15+ feet. Why would he spend a ton of time on those 8 footers instead of working on getting closer to the hole? If your good chips turn into 3-5 footers, your great chips are now kick-ins, and your bad ones are now 10-15 feet away, you’re going to start making more putts without even having to make more 8 footers based on the fact that you’re now closer to the hole the majority of the time. Then he can work on those 8 footers after he starts improving his short game.
Again, I’m not saying that working on your putting is a bad idea by any means; pretty much everyone should do it more than they do. Obviously making more 8-footers is a great thing for anybody’s game, but that definitely wouldn’t be my go-to for this type of player. Unless he’s going to start hitting more greens in regulation (then he’d need more help lag putting most likely), he’d be much better served working on getting his average short game shot down from that 14 foot distance. He’ll likely drop significantly more strokes doing that than making 20% more of his 8 footers.
Your email address will not be published. Required fields are marked *
This site uses Akismet to reduce spam. Learn how your comment data is processed .
You may like
Clement: laid-off or perfect fade across-the-line or perfect draw.
Some call the image on the left laid off, but if you are hitting a fade, this could be a perfect backswing for it! Same for across the line for a draw! Stop racking your brain with perceived mistakes and simply match backswing to shot shape!
The Wedge Guy: The easiest-to-learn golf basic
My golf learning began with this simple fact – if you don’t have a fundamentally sound hold on the golf club, it is practically impossible for your body to execute a fundamentally sound golf swing. I’m still a big believer that the golf swing is much easier to execute if you begin with the proper hold on the club.
As you might imagine, I come into contact with hundreds of golfers of all skill levels. And it is very rare to see a good player with a bad hold on the golf club. There are some exceptions, for sure, but they are very few and very far between, and they typically have beat so many balls with their poor grip that they’ve found a way to work around it.
The reality of biophysics is that the body moves only in certain ways – and the particulars of the way you hold the golf club can totally prevent a sound swing motion that allows the club to release properly through the impact zone. The wonderful thing is that anyone can learn how to put a fundamentally sound hold on the golf club, and you can practice it anywhere your hands are not otherwise engaged, like watching TV or just sitting and relaxing.
Whether you prefer an overlap, interlock or full-finger (not baseball!) grip on the club, the same fundamentals apply. Here are the major grip faults I see most often, in the order of the frequency:
Mis-aligned hands
By this I mean that the palms of the two hands are not parallel to each other. Too many golfers have a weak left hand and strong right, or vice versa. The easiest way to learn how to hold the club with your palms aligned properly is to grip a plain wooden ruler or yardstick. It forces the hands to align properly and shows you how that feels. If you grip and re-grip a yardstick several times, then grip a club, you’ll see that the learning curve is almost immediate.
The position of the grip in the upper/left hand
I also observe many golfers who have the butt of the grip too far into the heel pad of the upper hand (the left hand for right-handed players). It’s amazing how much easier it is to release the club through the ball if even 1/4-1/2″ of the butt is beyond the left heel pad. Try this yourself to see what I mean. Swing the club freely with just your left hand and notice the difference in its release from when you hold it at the end of the grip, versus gripping down even a half inch.
To help you really understand how this works, go to the range and hit shots with your five-iron gripped down a full inch to make the club the same length as your seven-iron. You will probably see an amazing shot shape difference, and likely not see as much distance loss as you would expect.
Too much lower (right) hand on the club
It seems like almost all golfers of 8-10 handicap or higher have the club too far into the palm of the lower hand, because that feels “good” if you are trying to control the path of the clubhead to the ball. But the golf swing is not an effort to hit at the ball – it is a swing of the club. The proper hold on the club has the grip underneath the pad at the base of the fingers. This will likely feel “weak” to you — like you cannot control the club like that. EXACTLY. You should not be trying to control the club with your lower/master hand.
Gripping too tightly
Nearly all golfers hold the club too tightly, which tenses up the forearms and prevents a proper release of the club through impact. In order for the club to move back and through properly, you must feel that the club is controlled by the last three fingers of the upper hand, and the middle two fingers of the lower hand. If you engage your thumbs and forefingers in “holding” the club, the result will almost always be a grip that is too tight. Try this for yourself. Hold the club in your upper hand only, and squeeze firmly with just the last three fingers, with the forefinger and thumb off the club entirely. You have good control, but your forearms are not tense. Then begin to squeeze down with your thumb and forefinger and observe the tensing of the entire forearm. This is the way we are made, so the key to preventing tenseness in the arms is to hold the club very lightly with the “pinchers” — the thumbs and forefingers.
So, those are what I believe are the four fundamentals of a good grip. Anyone can learn them in their home or office very quickly. There is no easier way to improve your ball striking consistency and add distance than giving more attention to the way you hold the golf club.
More from the Wedge Guy
- The Wedge Guy: Golf mastery begins with your wedge game
- The Wedge Guy: Why golf is 20 times harder than brain surgery
- The Wedge Guy: Musings on the golf ball rollback
Clement: Stop ripping off your swing with this drill!

Not the dreaded headcover under the armpit drill! As if your body is defective and can’t function by itself! Have you seen how incredible the human machine is with all the incredible feats of agility all kinds of athletes are accomplishing? You think your body is so defective (the good Lord is laughing his head off at you) that it needs a headcover tucked under the armpit so you can swing like T-Rex?

Dave Portnoy places monstrous outright bet for the 2024 Masters

John Daly stuns fans into silence with brutal opening tee shot on PGA Tour Champions

Justin Thomas on the equipment choice of Scottie Scheffler that he thinks is ‘weird’

Things got heated at the Houston Open between Tony Finau and Alejandro Tosti. Here’s why

Tiger Woods arrives at 2024 Masters equipped with a putter that may surprise you

‘Absolutely crazy’ – Major champ lays into Patrick Cantlay over his decision on final hole of RBC Heritage

Report: Tiger Woods has ‘eliminated sex’ in preparation for the 2024 Masters

Two star names reportedly blanked Jon Rahm all week at the Masters

Report: LIV Golf identifies latest star name they hope to sign to breakaway tour

Neal Shipley presser ends in awkward fashion after reporter claims Tiger handed him note on 8th fairway

Kris Kim WITB 2024 (May)
Kris Kim what’s in the bag accurate as of the CJ Cup Byron Nelson. More photos from the event here....

Richy Werenski WITB 2024 (May)
Richy Werenski what’s in the bag accurate as of the CJ Cup Houston Open. Driver: Titleist TSR3 (10 degrees, D1...

Wesley Bryan WITB 2024 (May)
Wesley Bryan what’s in the bag accurate as of the CJ Cup Byron Nelson. Driver: Callaway Paradym Ai Smoke Triple...

Adam Scott WITB 2024 (May)
Adam Scott what’s in the bag accurate as of the 2024 CJ Cup Byron Nelson. Driver: TaylorMade Qi10 (10.5 degrees)...

Brandel Chamblee has ‘no doubt’ who started the McIlroy/LIV rumor and why

LET pro gives detailed financial breakdown of first week on tour…and the net result may shock you

Jason Day on his recent switch into Srixon ZX5 and ZX7 Mk II irons
Table of Contents

Last updated Jan 17, 2024
What is Strokes Gained Putting? Explained.
Strokes gained putting is a golf statistic used by the PGA Tour that provides an objective measure of putting skill across golfers, courses, and tournaments.

Written By: Zach Gollwitzer
Posted in: Golf Statistics
Tags: Data-Driven Golf
Whether you're trying to improve your golf game or maybe, just find an edge in your fantasy golf league, strokes gained putting is one of the most important stats you can look at.
We've all heard the phrase drive for show, putt for dough , but is that actually true?
In this post, I'm going to show you why that saying may not be entirely true.
Putting doesn't matter as much as we once thought...
The strokes gained putting (SGP) statistic tells us how skilled a golfer is at putting .
What is measured?
Any shot that is hit on the putting green is tracked under the strokes gained putting statistic. Putts from the fringe are NOT tracked.
Calculation and Formula
The formula for strokes gained putting (SGP) is:
SGP = Avg. Expected Strokes - Actual Strokes
Where "Avg. Expected Strokes" is a "benchmark" calculated from hundreds of thousands of putts from the tour's ShotLink system which gives an estimate of how likely a golfer is to make a putt of a certain distance.
Can Amateurs use this stat?
Yes, I recommend Arccos for tracking your strokes gained statistics.
Does putting matter as much as we think?
Conventional wisdom says that putting is the most important part of the game.
But according to the research done by Mark Broadie in Every Shot Counts , strokes gained data tell a different story.
What if I told you...
- On average, great putting only contributes ~35% to tour victories, while the long game contributes the remaining 65%
- On average, the best golfers in the world only gain ~15% of their advantage through putting
- The long game explains the majority of the difference between pros and amateurs, NOT putting
And to blow your mind even further, here's real data from Broadie's analysis showing the likelihood of amateurs and pros making different length putts:
As expected, pros putt better than 90s golfers.
But did you expect such a small margin?
Probably not!
In reality, the pros gain most of their strokes on amateurs with their long games, NOT their putters. You are better at putting than you think.
And now that your mind is spinning with questions, let's jump in and learn more about this elusive statistic.
What is strokes gained putting?

Strokes gained putting is a measure of relative putting performance and is one of several strokes gained statistics tracked by the ShotLink system on Tour. You can find the official statistics on the PGA Tour website . Amateur golfers can track this through systems like Arccos as I'll explain later in this post.
In the screenshot above, you can see that during the 2023 season, Maverick McNealy led the tour in strokes gained putting. On average, McNealy gained 0.956 strokes on the field per round, and during the 2023 season, gained 46.822 strokes on the field over all his rounds.
While the official stat measures strokes gained putting by round, we can measure it in many different ways. Given the right data, we could measure strokes gained putting:
- For a single golf hole
- For a round of golf
- For a full golf tournament
- For an entire golf career
- Between two golf courses
- Between two golf tournaments
In other words, we could say that Rory Mcilroy "gained 2.2 strokes on the field during the Players Championship".
We could also say, "Over his career, Rory Mcilroy has lost 0.2 strokes against his peers on the putting green"
Or even, "Pebble Beach's greens are 0.3 strokes harder to putt on than Bethpage Black's greens".
I know, I know, this is confusing! Let's take a look at some examples to better understand the elusive strokes gained putting metric.
How strokes gained putting differs from putts-per-round
Putts-per-round is a traditional golf statistic that simply measures how many total putts a golfer takes in a round of golf.
The PGA Tour average for this statistic generally hovers around ~29 putts per round , and most amateurs take 32-40 putts per round.
This statistic is great for a simple measure of putting performance, but has many limitations:
- It doesn't factor in course conditions and difficulty
- It is heavily influenced by your performance in other parts of your game (i.e. if you chip it close a lot, your putts per round will be low)
That's why strokes gained putting is a much more objective and overall better method of assessing the overall putting performance of a golfer.
How is strokes gained putting calculated?
Calculating strokes gained putting is simpler than you think! At its core, this metric revolves around comparing a player's performance on the putting green to a statistical standard, typically derived from data collected on professional tours like the PGA Tour. It's a great way to objectively assess putting prowess.
Strokes Gained Putting Formula
The basic formula for strokes gained putting is:
Strokes Gained Putting = Expected # putts (benchmark) - Putts Taken
For example, if the baseline expectation for a 10-foot putt is 1.6 strokes (meaning players typically make the putt 40% of the time), and a player makes the putt in 1 stroke, their strokes gained putting for that shot would be:
Strokes Gained Putting = 1.6 - 1 = 0.6
Making a 10-footer gains 0.6 strokes.
If the player had missed this putt, the calculation would have been:
Strokes Gained Putting = 1.6 - 2 = -0.4
In other words, making the 10-footer gains the player 0.6 strokes while missing loses them 0.4 strokes.
Basic Calculation Method
As with other strokes gained statistics , putting is tracked using the following basic methodology:
- Establish a Baseline : The baseline is the average number of putts a player is expected to take from a specific distance. This data is usually gathered from extensive statistics on professional tours. For instance, if the average pro makes a 10-foot putt 40% of the time, the expected strokes to hole out from that distance is 1.6. If an amateur is calculating strokes gained, they will typically compare to players of similar handicaps (skill levels) through an ecosystem like Arccos.
- Compare Individual Performance : Next, we compare a player's performance to this baseline. If I sink that 10-foot putt, I've taken one stroke. Since the baseline is 1.6 strokes, I've gained 0.6 strokes on this putt against the average.
- Aggregate Data Over Rounds : This process is repeated for every putt in a round, and the values are aggregated. Positive values indicate better-than-average putting, while negative values suggest there's room for improvement.
- Adjustments : Sometimes, adjustments are made for factors like green speed and undulation, ensuring a fair comparison across different courses and tournaments.
Step 1: Establish the baseline
For our baseline, let's assume that on the PGA Tour, here are the average probabilities of making putts at various distances:
In other words, if we have a 10-foot putt, we can say that on average, a tour pro is expected to take 1.61 putts from this distance, or in other words, has a 40% chance of making it.
Step 2: Compare individual performance
Now, let's say that we're trying to calculate strokes gained putting for Dustin Johnson. Let's say that below are his first 3 holes of putts at a tournament:
In his first 3 holes, based on first-putt distances and tour averages from those distances, you can see which putts Dustin gained strokes and lost strokes on.
For example, he made a great 20-foot putt on hole 2, which gained him 0.87 strokes on the field, while missing his first putt from 10 feet lost him 0.39 strokes on the field.
Step 3: Aggregate
Now that we have a table of putts, we can aggregate these. In the example above, if we add up the total strokes gained in the last column, we get a value of 0.4. This means that against a group of tour pros, Dustin gained 0.4 strokes on "the field" during his first 3 holes of putting.
You could continue this exercise through the entire round to see how Dustin putted compared to tour averages.
Additionally, you could compare this value to other rounds that Dustin played.
For example, we could get super granular and calculate how well Dustin Johnson putts on his first 3 holes of a tournament:
By aggregating the strokes gained data for Dustin's first 3 holes each round of a tournament, we can conclude that he putts really well compared to the field on his first 3 holes! More specifically, in his first 3 holes of this particular fictional tournament, on average, he gained 0.24 strokes on the field.
Step 4: Adjust
Let's assume that during this round of golf, Dustin Johnson was playing at Pebble Beach, which has small and fast greens that are notoriously hard to putt on.
Let's say we wanted to compare his first-round putting performance at Pebble Beach with his first-round putting performance at the Valero Texas Open.
The Valero Texas Open is played at TPC San Antonio, which has much easier greens. It's not a fair comparison!
In order to normalize the statistics on the PGA Tour to adjust for the difficulty of the course, they calculate strokes gained normally and then make a "difficulty adjustment".
For example, let's say that over hundreds of rounds, the PGA Tour has calculated that on average, tour pros lose 0.77 strokes vs. the standard benchmarks when playing Pebble Beach, and gain 0.35 strokes while playing at TPC San Antonio:
Let's consider the following scenario:
- Jordan Spieth plays Pebble Beach and has a strokes gained value of -0.60 (he lost 0.6 strokes against the tour benchmark for the round)
- Dustin Johnson plays TPC San Antonio and has a strokes gained value of +0.33 (he gained 0.33 strokes against the tour benchmark)
You might look at these performances and say, "Dustin is a better putter than Jordan".
But this is wrong!
The PGA Tour reports a modified version of strokes gained putting called strokes gained putting to the field .
This stat adjusts the SGP stat based on the course difficulty. In this case, we can adjust each player's round stat:
- SGP (Jordan Spieth @ Pebble) = -1 * (0.6 - 0.77) = 0.17
- SGP (DJ @ TPC San Antonio) = 0.33 - 0.35 = -0.02
Even though Jordan lost strokes against the overall tour benchmark, the course difficulty adjustment made it so his actual strokes gained value for the round was a positive 0.17 strokes. Likewise, Dustin gained strokes against the tour benchmark, but in reality, since he played an easier golf course, he lost 0.02 strokes.
While not perfect, this is an objective way to say, "Jordan putted better than Dustin during this round".
How Amateur Golfers Can Track Strokes Gained Putting
At the time of writing, the golf industry has come a long way with consumer-grade technology. With the proliferation of shot trackers and personal launch monitors , it has become easier for amateur golfers to assess their games with real on-course data.
That said, tracking strokes gained putting statistics still proves difficult for many golfers.
Because as we talked about earlier, strokes gained calculations require benchmark data.
This means that for a 15-handicap golfer to assess their game with strokes gained putting data, all of the following things must be tracked:
- Every putt (and distance of the putt) must be tracked
- Thousands of golfers who play to a 15 handicap must also track their putts (mass tracking technology)
- All this data must be aggregated in one spot (ecosystem)
For the PGA Tour, this is easy. ShotLink tracks every golf shot from every tournament for every tour pro automatically.
For us amateurs, we don't have this luxury (and frankly, most of us probably don't want all of our shots tracked!)
There are a few options though and I'm excited to see how this evolves in the next decade!
Automatic Tracking
In my opinion, automatic strokes gained tracking is the best option. Tracking every shot for every round you play is exhausting and most golfers do not have the discipline to keep this up over a long enough period for it to start helping their games.
At the time of writing, here are a few shot trackers that also have strokes gained statistics built-in to their ecosystems:
- Arccos Shot Trackers: The Arccos system has strokes gained calculations available to users (via the app) and thanks to all the amateur data they have collected, you can compare your rounds against golfers of similar skill levels. This is a huge benefit and allows for the most accurate strokes gained data.
- ShotScope Trackers: A close second to Arccos, ShotScope offers shot trackers and an app that calculates strokes gained data. From what I've seen, ShotScope does not have quite as many data points as Arccos, but is a great alternative.
Manual tracking
Several apps allow you to track all of your shots manually and then review strokes gained data within the dashboard. While this can be cumbersome and exhausting to some golfers, it is a great option if you are highly disciplined and dedicated to improving your golf game.
Here are a few to check out:
- My Round Pro
- PinPoint Golf
- Decade Golf: This is more of a system than an app. While it does have an app, this is a premium service you pay for to help learn better golf strategy based on strokes gained data.
- Excel Spreadsheet: Yep, you heard me! Track your putts and distances while on the course and then upload them to a basic spreadsheet. While this approach is not easy when tracking all of your shots, it is very doable for tracking putts only.
Other Types of Strokes Gained Statistics
At this point, you might be thinking—"Zach, we've talked a lot about putting, but what about the rest of my game?"
And you would be correct.
Strokes gained is more than just putting . It is an entire framework for measuring relative golf performance in all areas of a golfer's game:
- Strokes gained putting (this article)
- Strokes gained around the green
- Strokes gained approach
- Strokes gained off the tee (driving)
Concluding Thoughts: Why you should care about strokes gained putting
As with any golf statistic, getting real data to measure your game can be invaluable because it tells you what to practice .
While I'd be confident in saying that most amateurs would benefit tremendously from practicing putting, I could even more confidently point at strokes gained statistics and prove that in the long run, practicing long game is the best way to consistently improve an amateur's golf score.
To put all this in action, I have a challenge for your next round. Next time you play:
- Distance of putt
- Did you make it?
- When you get home, add these stats to an Excel spreadsheet
- Keep doing this for 2-3 rounds
- After 2-3 rounds, calculate your averages at various putt lengths
By doing this simple exercise, you have built yourself a database of strokes gained putting data to compare yourself against for future rounds!
About the author: Loading...
About the author: zach gollwitzer.

Hey, I‘m Zach, the founder of The DIY Golfer! I created this site while playing D1 collegiate golf with a simple mission—I wanted to learn the golf swing and get better at golf myself.
Fast forward a few years, and my “journal“, The DIY Golfer, has been viewed by millions of golfers worldwide looking to do the same with their games. my mission is to make golfers more consistent in just a few hours a week through advanced practice strategies and timeless, first-principle golf instruction.
This Page is Mentioned in...

Strokes Gained
Strokes gained is a golf stats methodology popularized by Mark Broadie and adopted by the PGA Tour which measures a golfer's skill by each part of their game.

Strokes gained around the green is an objective way to measure a golfer's chipping. In this post, I'll explain how it is calculated and why it matters.

Strokes gained off the tee is an objective way to measure a golfer's driving ability. In this post, I'll explain how it is calculated and why it matters.

Strokes gained approach is an objective way to measure a golfer's ball-striking ability. In this post, I'll explain how it is calculated and why it matters.
Other Articles in 'Golf Statistics'

This post outlines the most common golf statistics you should be tracking to improve your game and see your progress over time.

In Every Shot Counts, Mark Broadie introduces a revolutionary approach to game improvement—the strokes gained approach. But will it help your game?

Putting Statistics by Handicap: Which Stats to Track?
In this guide I’ll share recent data on putting statistics by handicap so you can see how well golfers like you are putting in different categories. Tracking putting stats is important to improving your short game so you can see where your weaknesses and strengths are and adjust strategy on the golf course.
One of the fun aspects about tracking your putting stats is you can compare them with the putting statistics of professional golfers to see how you fare. Putting is one area where amateur golfers can actually become as good as professionals.
In order for the amateur golfer to better understand how well the best players in the world actually putt, let’s take a look at the putting statistics on the PGA Tour.
Putting Stats
The following key putting statistics will give the amateur golfer perspective about how good or bad the pro’s actually putt in reality. Track these putting stats in your own golf game to see how you compare.
- Putts per round
- Putts from 3 feet
- Putts from 6 feet
- Putting from 10 feet
- Putts made from over 20 feet per event
Resource: Golf Practice System with Step by Step Practice Plans + Video Lessons
Putts Per Round
The PGA Tour keeps record of basically every putting stat that can be tracked via their Shotlink system. You can find a full page of putting stats here.
One of the most common stats that most golfers, even high handicap amateur golfers, know about are putts per round.
This tracks how many total putts a golfer has during a round of golf. If you are giving yourself 2-putts per hole as a goal and you play 18 holes, then that would calculate out to 36 putts per round you’d expect to hit.
The leader on the PGA Tour each year has usually averaged around 28 putts per round, so 8 shots lower than the 36 putt goal.
Looking at this stat will make the average golfer realize that having 30 putts or less per round is a very solid goal to strive towards instead of setting the goal at 36.
Putts per round by handicap:
- Professional golfer = 28-32 putts
- Scratch golfer = 30-34 putts
- Average golfer = 36-40 putts
- High handicap = 45+ putts

Putts from 3 Feet – Make Percentage
Normally during a round with friends most amateurs are very quick to give each other 3 and 4 foot putts, calling them good and letting the putt be picked up, rather than putted out to finish the hole.
If your playing partner is Patrick Cantlay then yes you can go ahead and give those putts to him, but on average social golfers don’t make nearly as many short putts as they should.
Patrick Cantlay made every single 3 footer that he had on the PGA Tour season. That’s over 700 3-footers made in a row to be exact!
You don’t have to make every single 3 footer that you have, but it will definitely improve your golf score if you can at least make 80% of your 3 footers on average.
Before you give yourself that 3 footer, ask yourself, is this going to benefit me by skipping the putt or will it help me get extra practice under pressure by making myself putt out?
3 Foot Putts by Handicap:
- Professional golfer = 99% (10 out of 10)
- Scratch golfer = 95% (9 out of 10)
- Average golfer = 60% (6 out of 10)
- High handicap = 40% (4 out of 10)
Putts from 6 feet – Make Percentage
Patrick Cantlay making a 100% of his 3 footers during a golf season is very impressive, but the human aspect in putting begins to show from the 6 foot mark.
Brian Harman was the leader in this recent PGA season with a 6 foot make percentage rate of 91%, which is still an incredible feat to achieve.
6 foot putts are your money range. They’re going to help you save pars and set you apart from the average golfer. Spend a lot of your putting practice time on this distance.
If professionals are averaging 80-90% from 6 feet, then set a goal for your game to achieve a 75% or better make rate at 6 feet. This will take 1000’s of reps to build skill but it’s a great goal to aim for and impress your opponents on the golf course.
6 Foot Putts by Handicap:
- Professional golfer = 85% (8 out of 10)
- Scratch golfer = 75% (7 out of 10)
- Average golfer = 20% (2 out of 10)
- High handicap = 10% (1 out of 10)
Putts from 10 Feet – Make Percentage
At the 10 foot mark, the percentage of putts made decreases considerably.
Zach Johnson held the top spot this recent season with a 70% make rate at 10 feet on the PGA Tour, and the last place player was at just 23%
Amateur golfers can learn a lot by looking at this statistic, having perspective about what realistic expectations are to have of yourself is a great start.
If a PGA Player only makes 3 out of 10 of his 10 foot putts for a 30% make rate then you definitely can’t get mad at yourself for missing them out on the course.
The average make percentage at 10 feet for the PGA Tour fell around 40%. Anyone above 50% was top 20 in the league.
10 Foot Putts by Handicap:
- Professional golfer = 40% (4 out of 10)
- Scratch golfer = 20% (2 out of 10)
- Average golfer = 0-5% (0 out of 10)
- High handicap = 0-1% (0 out of 10)
Green in Regulation Made Putts from 10-15 Feet
This putting stat tracks your birdie make percentage. When a professional golfer hits the green in regulation, what are the chances he makes the putt.
In this stat we chose to highlight the 10-15 foot birdie putt, and the leader on the PGA Tour was Adam Scott at 42% conversion.
Therefore, if he can hit his approach shots inside of 15 feet, Scott has a good chance of making 1 out of every 2 putts for birdie.
Putts made from over 20 feet per round
We all remember that long putt we made to save par or better yet that 30 foot birdie putt to win the money game against your friends.
No surprise that Jordan Spieth is right up there at the top of the leaderboard in this statistic.
Patrick Cantlay is technically the leader in this category with 2.3 putts made over 20 foot per round.
Spieth ranked 2nd in this category with 2.2 putts made over 20 foot per round.
Justin Rose is also high on the leaderboard for make percentage from 20 feet or beyond. He sank 10% of his 20 foot putts overall, and when he was on the green in regulation that stat jumps to 28%.
How to Track Your Putting Statistics
Start by giving yourself a couple blank lines on the scorecard for writing in putting stats. Then transfer these stats over to a spreadsheet or an app like 18Birdies so you can keep data digitally on your smart phone.
During practice I like to pull up notes on my phone and log putting stats for different drills I complete.
For example, if I do the make 100 putts from 3 feet drill, I’ll write down “99/100 – 3 feet” and then “70/100 – 6 feet” so I can compare my stats later on in future practices.
Golf Round Stats to Track on Scorecard
- Putts made at various distances
- Total putts per round
- Total 3 putts
- Birdie putt conversion rate
To some these putting stats might sound confusing, but if you take the time to read through it and process what they are portraying then they might actually give you perspective to use with your own putting skill level.
It is important to have realistic goals and expectations of your golf game, as having unrealistic expectations will only add pressure and anxiety to your mental game, causing worse performance.
These statistics can also add value to your practice regime. Knowing how many putts the best players in the world make from a certain distance can provide you with a good goal to work towards.
Golf Practice System for Lower Scores
Learn the exact golf practice routines thousands of students at Foy Golf Academy are using to lower their golf scores.
Follow these step by step practice plans and watch video lessons to learn how to improve your golf swing, chipping, and putting fundamentals.
Get access to hundreds of golf drills to practice as well as content on the mental side of golf, fitness plans, worksheets, and many more resources. This is a complete golf practice system.
Start Following These Practices —> Nick Foy Golf Practice System
Nick Foy, Instructor

*Some links on this page may contain affiliate links. Thank you for supporting me.
Don’t miss out
Breaking 90, 80, 70 golf practice plan.

The 15 Best Golf Drills that
Lowered my golf scores.
Sign up to get this resource + more helpful golf lessons to your inbox
Putting Statistics Every Golfer Should Know
Watching players on the PGA Tour you might be forgiven for thinking that they never seem to miss. This might be doing your own game no favors because you put yourself under additional pressure.
How Often Do Tour Players Miss Short Putts?
What is strokes gained putting, total putts or putts per round, putts per green in regulation (gir), three-putt avoidance, birdie conversion rate, start by getting closer to the hole, putting statistics every golfer should know: conclusion.
In reality, even tour players miss plenty of putts. While putting stats have changed in recent years to use strokes gained putting as arguably the most important measure there are still plenty of putting statistics every golfer should know if they want to improve their game and reduce the number of putts they take on a consistent basis.
Tour pros miss short putts more often than you might think. In fact, many Tour pros will say that missing a short putt is one of the most frustrating things that can happen during a round. While it may seem like they should be able to make an 8-foot putt with ease, the truth is that even the best players in the world miss these putts from time to time.
Looking at the stats from the 2021-22 season, Yonas Blixt, was the best performer inside 8 feet managing to hold 76% but the tour average was only 54%. Yes, that’s right the best players on the planet missed almost half their eight-footers. So the next time you miss an eight-footer for par don’t jump to whack yourself with your putter! Guys that are spending all day pretty much every day working on their game miss half the time. They also have the advantage of playing on greens that are usually in peak condition. Many amateur golfers suffer greens that are not much better than the aprons at some top courses.
Strokes gained putting is a metric used to measure how much better a golfer is at putting than the rest of the field. The strokes gained formula was originally developed by Prof Mark Broadie from Columbia Business School. It uses the ShotLink data to work out whether a player has performed better or worse than the field on a given hole and cumulatively for the round.
From all the data that is collected at every tournament, it is possible to calculate the probability of a player holing out from any given distance either on the green or off it.
To give a simplified example the data would suggest that from 30 feet tour players will two put 88% of the time, they will one put 7% of the time and the remaining 5% will be three putts or more. This means a player putting from 30 feet would be expected to take on average 1.977 putts.
So if a player happens to hole their 30-footer they have effectively gained a shot compared with the probability.
There are a number of online calculators that will allow you to work out your strokes gained figure compared with the PGA Tour probabilities.
Key Putting Statistics
As the focus has moved onto strokes gained statistics the simpler old-fashioned stats aren’t referenced quite as often but for amateur players they can still be useful.
There are a few key putting statistics that can give you an idea of how well you are doing on the greens.
The simplest putting stat to calculate. It is just a total of the number of putts taken during the round. If you’re taking more than 36 putts then you need to work on your putting performance. You are probably not getting your first put close enough to the hole to give you a good chance of making the next one. You may also be struggling to hole out those shorter putts. Try to work out which is your Achilles’ heel so you can work on your stroke on the practice putting green.
Lucas Herbert was the PGA Tour player with the fewest putts per round last season, averaging 27.7.
If you find that you are averaging around two for this particular stat then that might show that your approach play needs work in order to get you closer to the hole for your first putt. We’ve already seen that even the best players only hole half their putts from 8 feet so if your approach play consistently leaving you 30-foot putts then your arms of making them are going to be low no matter what your level of putting skill.
This statistic shows how often a golfer is able to avoid those costly mistakes. For the 2022 season, Cameron Smith led the way with only 18 three-putts in 66 rounds which meant a 1.61% chance of him three-putting the holes he played. The tour as a whole averaged 3% or roughly one three-putt every two rounds.
A combination of better approach play and solid lag putting would give you a great chance of approaching these figures.
Gives you an idea of how often a golfer is able to take advantage of opportunities by turning them into birdies. This is usually also dependent on how close you are able to hit your approach shots.
For the average golfer getting the ball closer to the hole for your first putt should lead to better statistics overall because no matter how good you are the percentage of putts you make outside 8 feet is pretty low most of the time.
Wherever possible try to give your putts a chance to drop. If you continually leave putts short then that going to affect your make percentage.
the beauty of statistics is they can usually tell whatever story you want by picking the most advantageous ones to your cause. While you’re unlikely to ever reach the levels of PGA Tour putting statistics there’s no reason why you can’t improve your three-putt avoidance which should directly influence your handicap index.

Passionate golfer, although not as good as I'd like! I love playing in competitions and meeting new people.
Similar Posts

Left Eye Dominant Putting Tips
Left Eye Dominant Putting Tips Eye Dominance And Why Its Importance In Golf Your dominant eye is your most important asset when it comes to playing golf. Without good aim, you’ll make it harder to get that ball in the hole! Table Of Contents− Left Eye Dominant Putting Tips Eye Dominance And Why Its Importance…

Tips To Improve Your Putting
Tips To Improve Your Putting If you are serious about lowering your scores, then you must take putting seriously. Almost half the shots you play are likely to be on the green. No matter how good a golfer you are, if your putting is not up to standard, you will never score as well as…

Distance Control Putting Tips
Distance Control Putting Tips Distance control when putting is a very important skill to master. Statistically speaking you won’t consistently hole putts outside the 8-10 foot range so you need to get your first putt as close as possible in order to avoid racking up too many three-putts and ruining your score. Table Of Contents−…

Putting Tips For High Handicappers
Putting Tips For High Handicappers Golf is a game of precision and skill, but it can be incredibly difficult for high handicappers to get the hang of. It’s easy to become frustrated with your golf game if you don’t make progress quickly enough. However, there are tools and tips that can help even the highest…

Different Putting Techniques To Improve Your Scores
Different Putting Techniques To Improve Your Scores Are you a golfer looking to take your game to the next level? Putting can be one of the most challenging aspects of golf, but it doesn’t have to be. In this blog post, we’ll discuss different putting techniques that will help you improve your scores and become…

How To Use Line On Golf Ball For Putting
How To Use Line On Golf Ball For Putting The putting green is a refuge of tranquility; the peaceful landscape of lush grass often provides a much-needed escape from life’s daily hustle and bustle. It can also be a testing ground for golfers, as mastering these subtle yet important shots takes both skill and patience….

TrackMan Average Tour Stats

Tour stats include:
Club Speed, Attack Angle, Ball Speed, Smash Factor, Launch Angle, Spin Rate, Max Height, Land Angle and Carry.
TrackMan Average Stats Taken From The PGA TOUR

TrackMan LPGA Tour Average Stats

80 comments
So the average male Tour pro hits down on the ball slightly with the driver? Should attack angle vary with clubhead speed?
The attack angle for the pros varies on woods, but it’s more or less negative when it comes to hybrids and irons. For the average player, the attack angle on drivers varies and in general so should the ball that is hit from the ground always have a negative attack angle in order to get a better margin of error for the impact.
However, in order to get the longest carry possible, the ball should launch high with low spin. The optimal numbers are individual based on club speed – and that type of flight can easier be achieved if the spin loft is low together with a high dynamic loft. The more the attack angle is negative, then the higher the spin loft gets => the attack angle should be closer to 0 if anything IF the goal is to carry as long as possible.
But generally, the attack angle for irons should be from -2 – -5 for almost all players, but for drivers you can hit it further with a positive attack angle, no matter the club speed.
Niklas Bergdahl Support Manager EMEA & Asia
Can you send me the optimal numbers across the board that players and coaches should be looking for in lessons and trackman sessions
Strangely enough, with a driver you can achieve a carry of 300 vs 275 with the same clubhead speed of 113. Adam Young tries to get people to convert to this method. Attack angle = +8 degrees Launch angle = 19 degrees Backspin = 2,000 Smash Factor= 1.5
Hi. I can only confirm. I achieve those positive angles and l can carry the driver (9 degr loft) 245 yards with a club speed of 95mph. Rollout is average 20 yards.
No, it is 3° and that means the clubhead is movin upwards. – is downwards.
You are reading the LPGA (ladies) numbers Tim. The PGA (men) average is -1.3.
Looks like the average LPGA players trackman swing speed is more or less the same as an average 10 hcp male player. Though the ladies are a lot more skilled in hitting it on the right angles and in the right spot on the clubface. Would an average 10 hcp male player have a advantage or disadvantege using graphite shafts?
Harry, any player of any handicap can benefit from graphite shafts. More often than not, the memory in most players’ minds from graphite stems from a very long time ago when graphite was ONLY graphite. It was whippy, and not very accurate. Material advances and composite technology have nearly rendered steel obsolete. I say nearly, mind you. There are a number of outstanding graphite shafts out there that are super stable and responsive, enabling a lighter club and longer distance without sacrificing accuracy. Fujikura makes some really nice iron shafts that fuse both steel and graphite technologies called MCI. In fact, i have Fuji PRO 95i shafts in my irons and my iron game is better now than it ever was with steel. I’m a 3.5 index and relatively strong but it allows me to play all out without getting tired on the back 9 from heavy clubs. Being a club builder, i can tell you that in golf equipment there’s a trade-off in everything. wether it’s length, weight, or feel so your advantage or disadvantage is dependent on how precisely you build your piece of equipment.
Hey Chris thanks for the info below i find it very interesting. Curious do you have those same shafts in your wedges or do you have steel in your wedges? I played SteelFiber i95 shafts last year in all my irons including wedges. I liked them in my irons but i felt like it hurt my game in wedges. Do you have any thoughts on this? Thanks
Agreed. Shallow your angle of attack to match the LPGA players.
I have had a number of sessions on a Trackman, (the latest on Aug 22, 2015, at “Modern Golf” in Mississauga On.). My clubhead speed and distances are about the same as LPGA averages. I was doing wedge work, and see that for a pitching wedge, (48°), my angle of attack -about 7.5° – is n=much higher than LPGA average. My accuracy is good, (only 3 0f 19 shots more that 20′ away, and all when the face angle was over 4° closed). I’m thinking that I should weaken my left hand a bit, (it’s a little strong on pitch shots), and play the ball farther forward- 2″ ahead of centre. Am I on the right track, or will these changes introduce new problems?
I’m 74 years old, and am a long-time PGA of Canada member. Thanks for any feedback…. love Trackman outings.
I would recommend that you visit one of our certified coaches, he/she would be able to help you and find what numbers are best for you.
See our TrackMan Locator here.
I don’t disagree with these stats but I do it;s kinda weird. 87 miles mph with an 8 iron should produce 177 yards of carry not 160 that’s a lot of mph. Iv’e seen high school kids hit 9 iron 165 and they don’t swing 100 mph with a 9 iron. When I swing hard I hit my 8 iron 155 and my legit radar read 72 mph so logic would dictate at 88 mph you would get more like 180 yards carry again that’s a lot of mph.
Remember that’s a carry number not total distance. Also since the pros produce significant more back spin, their ball flight is higher, landing angle loftier producing minimum roll whereas your total distance might be benefiting from maximum roll. One more thing to check would be launch angle where you might be hitting a low ball flight to maximize distance which in my opinion is “cheating.”
The PGA Tour 8-iron goes 160 in the air for a couple of reasons. One, they usually hit weaker lofts than high school players (like I) do. Secondly, they spin their 8-iron at 7998 RPM to stop the ball on fast greens. I believe this is the combination that makes the 8-iron go so much shorter.
I’ve hit thousands of balls on Foresight simulators, and what I’ve found is that backspin significantly influences carry distance. Holding club head speed constant, greater backspin reduces carry distance on all clubs.
For mid-irons, I’d estimate that you lose roughly 5-7 yards of carry per 1,000 RPM in additional backspin. And with the driver it’s easily 10+ yards of carry lost per 1,000 RPM.
This explains why poorly struck balls will often fly as far, if not further, than a well-hit shot. The key to backspin is crispness of contact – a poorly struck shot simply won’t spin as much. Unless the impact is absolutely terrible, the lack of backspin on poorly struck shots will cause those balls to carry further than a well-struck ball. So if you’re flying balls over the green with your irons, the culprit could be too little backspin caused by poor contact, cheap balls, a dirty club face, etc.
I think this is also the key reason why fades don’t carry as far as draws. It’s not that a draw swing is any faster/more powerful – it’s simply that fades have more backspin due to the impact geometry/physics involved with that swing.
Now I may be wrong on some of this, so I’d love to get a true expert’s take.
One thing I forgot to add to my comment above is that you need a minimum of backspin on all golf shots just to get the ball up in the air. That may be 1,500 RPM for woods and maybe 3,000 for irons.
My point is that increasing backspin beyond this base level will generally reduce carry. For example, I can guarantee that increasing the backspin on your 7 iron from 5k to 7.5k will reduce your carry with that club, even if your swinging faster at 7.5k.
I totally disagree with your premise. Draws carrying further than fades? That makes no sense.
Bare in mind tour players play with proper golf clubs which are weak lofted so the people you see hitting a 9 iron further than tour average 8 it’s probably because that 9 iron is closer to a 7 iron loft
Spin determines weather you hit a draw or fade so logic would dictate distance will also be effected. In my experience draws do tend to be further for 2 reasons and both have to do with spin. With a draw you will usually get more roll out as well as flight because of the decrease in spin. This is especially true with a driver.
Depends what clubs you are using. There can be as much as 7 degrees of variation between a ‘standard’ loft on a 7 iron. If you’re playing the Callaway Mavrik irons, you’ll get 27 degrees of loft on a 7 iron. If you’re playing the Callaway Apex Pro then its 34 degrees. That’s a two club difference.
I was custom fit recently for the Apex 21’s and currently play Apex MBs. With the MBs my 7 iron has 34 degrees of loft and flies 165yds with 89mph average club head speed. Same swing with the Apex 21s (30 degrees of loft) flies between 177 – 180 yds. Big difference.
Larry , I would highly recommend you see Mark Evershed . Buy him lunch and get the answers your looking for .
Hi guys this was a recent session with a cobra 3 wood 16 deg loft.my question is my launch angle seems a little low ,interested in your thoughts .thanks Shot # Club Club Speed (mph) Ball Speed (mph) Smash Factor Launch Angle (degrees) Direction Back Spin (rpm) Carry Distance (yards) Total Distance (yards) 1 3 Wood 94 143 1.52 8.80 Straight 3874.00 215.00 232.00 2 3 Wood 98 148 1.51 9.10 Straight 4096.00 223.00 240.00 3 3 Wood 94 142 1.51 9.10 Straight 3904.00 213.00 230.00 4 3 Wood 94 143 1.52 8.80 Straight 3874.00 215.00 232.00 5 3 Wood 96 145 1.51 9.10 Straight 4000.00 219.00 236.00 6 3 Wood 94 143 1.52 8.80 Straight 3874.00 215.00 232.00 7 3 Wood 94 143 1.52 8.80 Straight 3874.00 215.00 232.00 8 3 Wood 93 141 1.52 8.80 Straight 3826.00 212.00 229.00 9 3 Wood 92 129 1.40 12.40 Straight 4138.00 190.00 207.00 10 3 Wood 94 142 1.51 9.10 Straight 3904.00 213.00 230.00 11 3 Wood 94 142 1.51 9.10 Straight 3904.00 213.00 230.00 12 3 Wood 94 143 1.52 8.80 Straight 3874.00 215.00 232.00 13 3 Wood 96 145 1.51 9.10 Straight 4000.00 219.00 236.00 14 3 Wood 93 140 1.51 9.10 Straight 3856.00 210.00 227.00 15 3 Wood 96 146 1.52 8.80 Straight 3970.00 220.00 237.00 16 3 Wood 92 140 1.52 8.80 Straight 3778.00 210.00 227.00 17 3 Wood 95 144 1.52 8.80 Straight 3922.00 216.00 233.00 18 3 Wood 96 145 1.51 9.10 Straight 4000.00 219.00 236.00 19 3 Wood 94 142 1.51 9.10 Straight 3904.00 213.00 230.00 20 3 Wood 91 137 1.51 9.10 Straight 3760.00 204.00 221.00 21 3 Wood 94 143 1.52 8.80 Straight 3874.00 215.00 232.00 22 3 Wood 95 144 1.52 8.80 Straight 3922.00 216.00 233.00 23 3 Wood 95 144 1.52 8.80 Straight 3922.00 216.00 233.00 24 3 Wood 96 146 1.52 8.80 Straight 3970.00 220.00 237.00 25 3 Wood 96 146 1.52 8.80 Straight 3970.00 220.00 237.00 26 3 Wood 96 145 1.51 9.10 Straight 4000.00 219.00 236.00 27 3 Wood 94 137 1.46 10.60 Straight 4054.00 204.00 221.00 28 3 Wood 94 143 1.52 8.80 Straight 3874.00 215.00 232.00 29 3 Wood 98 142 1.45 10.90 Straight 4276.00 213.00 230.00
What kind of balls were you using?
Brent. This was at a driving range with srixon range balls
Ok the one number that really stood out to me was the smash factor. Usually anything above a 1.50 indicates something is illegal. There’s a reason not even the PGA tour players aren’t averaging 1.50 off the tee. Other than that your numbers look good.
Brent what about the launch angle
Yes the launch is a little on the low side. But seeing how you’re still getting decent distance I wouldn’t worry too much about how it’s coming out. But try hitting down on the ball more to get it up in the air faster.
I frequently get above 1.5 on trackman with longer irons and my woods (I have raised this with your tech teams already). This is because your machine measures club speed just before impact and doesn’t detect acceleration through impact
Trackman doesn’t detect acceleration through impact on solidly struck shots so you can post smash factors above 1.5. It’s best to just rely on ball speed with Trackman
Brent in one of your comments you said my smash factor was high ,had a session last night at range and some of my smash factors were 1.53 is this something to try and change and if so how do I change it
Like you had said you were using range balls correct? If so the smash factor will be a little off since they aren’t a legal tournament ball. What the smash factor (as explained to me by the Carolinas PGA rules committee chairman) is, is a measurement of how well the ball comes off the face. There’s a specific calculation for it but I’m not positive of it and anything over a 1.50 usually is a tell tale sign that either the club or ball is illegal. What I would recommend doing is using the ball you would normally play a round with and get some readings off that ball.
I read not long ago that Rory Mcilroy had a smash factor of 1.53 as well . If Willie can hit it 380 the way Rory does, I wouldn’t change a thing.
Larry. I’m 55 years old 280 is my distance not 380 Like Rory
Ball speed divided by club head speed is smash factor
I’m currently doing my university project on green-side bunker shots, I was wondering if you have any shot data for a short bunker shot or flop shot? Thanks.
Sorry but we do not have any official data we can share, but it would be interesting to see your final research :)
Blair, My assumption would be that the cleaner a ball is picked out of a bunker the more spin it will have and vice versa. The more sand you use to move the ball the less spin.
Do you have TrackMan data for AoA and DL for greenside bunker shots?
Sorry we do not have any official bunker shot data.
In looking at the tour pro stats for men – the max height reading for all clubs is about 30 plus or minus 2. I am trying to understand how/why are the heights the same for all clubs? My assumption would be the more lofted the club the greater the height! Is 30ish the optimum figure for best distance? Because in my last stats my longest 9.5 degree driver shot was max height of 56!
Is there any data available from the Senior tour?
We do not have any official charts for the Senior Tour. But you can login on mytrackman.com and use the combine section and filter, to show only Senior Tour players.
Thanks Christian!
what month/year is this data from?
Is there any data on typical club path for a tour pro?
Can you please post stats for average path, club face, and face to path numbers for PGA tour?
Could you please post average path, club face, and face to path numbers for several top Tour Players?
Before all the hype about hitting up on the ball came about, I hit down on a driver anywhere from -2 to -4 degrees and swung 1-2 degrees left.
Once I started to try and swing up on it. I lost direction big time. An easy swing for me is 112, swinging hard at it I can get it up to 123. Does Trackman recommend those that have higher swing speeds to hit down on it for straighter direction?
There is no physics logic backing up that hitting up on the ball will give a decrease in accuracy. However to go from hitting down to hitting up you have made some changes to your impact obviously. The way you made the changes could well be the problem as this could have affected your impact location, swing path, clubface and the way you release the club
Can pga tour players carry the ball 293 yards.
A Question: Were some data change on this site? I ask because I’m quite sure to have read other data for the men’s driver trajectory. Am I wrong or can someone confirm this?
kindly zorro
Is my impression right, that the data for the men driver were changed from
[Daten alt: 112mph 165mph 11,2° 2685 31y 39° 269y] to [Daten neu: 113mph 167mph 10,9° 2686 32y 38° 275y] ?
Why did TM do that?
For the tour pro stats – mainly carry distance, launch angle and spin rate for the driver, you have the averages, could you supply the max and min (filtered for outliers)? I am going to run an experiment with Trackman at my golf academy and need a starting range for each item. The tour max and min range is a starting point versus having to create this from scratch.
Anyone know where I can find raw data of clubhead speed? It is for a College project. Thanks!
You know what would be great to see – average miss from target – left and right – for each club. Of course short and long from target matter as well, but solid contact isn’t really my issue – left and right misses is my challenge
I’m about a half club off of PGA Tour average distance wise. Technically I’m a 1 handicap, but more like 4 or 5 when the tourney pressure is on. I know from playing with better players the difference between me and them is pretty much how much more accurate they are from a left and right perspective.
You can find all this info from Mark Broadie. He has tracked all the shots on the us tour for years and also written a book Every Shot Counts about it
I have been playing Golf for less than 19 months. I must admit I was damn tired of the same Golf Lesson producing varying results with inconsistent instruction(s) which seemed contradictory to the previous lesson. I take Golf perhaps a little more serious than others and my “approach” to this game may be viewed as extreme due to my focus on Fitness/Strength Training combined with my Yoga and Nutritional regimen.
That notwithstanding I would like to formally THANK the Trackman Developers and Support Staff for FINALLY producing a “Standardized” curriculum eliminating the traditional random quick fixes and circumventing the often inconsistent and contradictory methods being taught today.
I currently own a Trackman 4 and although I DO NOT wish to teach, I am Certified as an Operator and successful in obtaining my Professional Level 1 & 2 Certifications and shortly will be submitting my Thesis to be considered for review. These Certifications have greatly assisted me in understanding Flight/Ball dynamics and greatly assists my Coach and I in our 4-5 hour daily Putting-Wedge-Iron-Wood and Driver Sessions providing the data necessary to produce a more consistent and …. I have a hard time with this next word…… F U N game. (There I said the word “fun” in the same sentence as “Golf.” I’m so proud of myself!!!
Seriously, I simply CANNOT thank Nathan Meyer for coming to my hometown and demonstrating the enormous benefit(s) of purchasing the Trackman 4 product.
Kym Fontana [email protected]
It has been an absolute pleasure getting to know you! Your work ethic, attitude, and kindness are all things that I can look up to. very excited for 2017 and I am looking forward to seeing you again soon!
-Nathan Meyer [email protected]
Are there numbers posted for an average 5 HCP player or 10 HCP player similar to the charts above for the ave tour player?
What is the #1 PGA Tour player in “Carry Distance” average carry distance??
I understand this data is pretty old, released soon after the time when trackman first came out. I’m sure things have changed since then. Any update?
Actually, we haven’t seen any huge changes over the past years, it’s more about roundings. For example, Avg. Club Speed for a driver: 2014: 113.0 mph 2015: 113.3 mph 2016: 112.9 mph And it’s pretty much similar with the other numbers.
We do have a graphical updated version of the Tour Stats here.
Not really. Lee Westwood was interviewed recently and advised that apart from his driver he hits everything else almost the exact same he has his entire career.
I’m looking for PGA tour averages for dynamic loft for different clubs. Does anyone have this data to share? Thanks!
Are there tour averages for club path?
Are all these stats full swings? Example: Would the avg tour pro hit a 6-iron further, if he turns fully and tries to hit it as far as possible (with a natural movement like on a driver – not with an unnatural swing that creates most possible power, but result in very unconsistent ball flight)?
Currently I practice indoors because of the winter. I do my practice with Trackman and I carry my 7 iron about 177-180 yards and total distance of 188-192 yards with my TaylorMade PSi irons. Lots of my shots with the 7 iron has a smash factor of 1.50-1.51.
This is a example of one of my shots with 7 iron.
Club speed: 80.2 | AoA: 1.3 | Ball speed: 120.5 | Carry: 164 meter | Total: 176 meter | Dyn Loft: 19.6 | Smash Factor: 1.50
Is that normal number for a 7 iron with a that club speed?
Averages are useful, but knowing them would be more useful if we knew the median and mode, as well as the range.
Hello, Are there updated PGA Tour Trackman stats?
On Trackman this week using 7i I noticed the spin rate I had was well below that of a pro by nearly 3,000 rpm but similar club speed and attack angle. How can I get my spin rate up?
It can vary a lot due to the ball and clubs you are using. For example driving range balls are normally very hard and will have much lower spinrates than a quality ball like a Titleist pro v1. Modern day irons are also built to higher the lauch angle and lower the spinrate so that the average golfer will achieve more distance
It would be great to know the average loft for each club, especially the irons!. I think 21-24-27-30-34-38-42-46 (3-Pw) are reasonable specs. What do you guys think?
What loft are the irons? A modern 7i is now 30°
Is this still the original data from 2015 or has it been updated?
I’d be very curious to see if the how the average attack angle has changed over this time in the PGA.
Please update this data from over the years of more testing.
Do you have any numbers on tour averages numbers on dynamic loft and spin loft?
I am a 2 handicapper and I hit my driver 280 yards on an average. What is the attack angle with driver of the best players on the pga tour?
these yardages are no doubt well below reality.
6 iron only 183yds carry? Most high handicappers hit it equally far.
Leave a Reply Cancel reply
- Coach Of The Month
Subscribe and get the latest Insights!
Recent comments.
- Keith Rogers on Paul McGinley – How To Practice
- Anthony on 6 TrackMan numbers all amateur golfers should know
- BillM on TRACKMAN HANDICAP
- Tim Work on How To Work On Attack Angle
- WAYNE B EISMAN on 6 TrackMan numbers all amateur golfers should know
Stay updated
Stay up to date and receive free notifications of new posts by email.
Email Address
Subscribe - It's Free!
- Coach of the month
PGA TOUR Player Stats 2024
- Statistics are updated nightly
- AGE : Current age of player
- EARNINGS : Official money won
- CUP : FedExCup Points
- EVNTS : Tournaments played
- RNDS : Rounds played
- CUTS : Cuts made
- TOP10 : Top 10 finishes
- WINS : Wins
- SCORE : Scoring average per round
- DDIS : Driving distance (in yards)
- DACC : Driving accuracy %
- GIR : Greens In Regulation %
- PUTTS : Putts per hole
- SAND : Save Percentage
- BIRDS : Birdies per round
- Terms of Use
- Privacy Policy
- Your US State Privacy Rights
- Children's Online Privacy Policy
- Interest-Based Ads
- About Nielsen Measurement
- Do Not Sell or Share My Personal Information
- Disney Ad Sales Site
- Work for ESPN
- Corrections
- CBSSports.com
- Fanatics Sportsbook
- CBS Sports Home
- Triple Crown
- Champions League
- Motor Sports
- High School
Men's Brackets
Women's Brackets
Fantasy Baseball
Fantasy football, football pick'em, college pick'em, fantasy basketball, fantasy hockey, franchise games, 24/7 sports news network.
- CBS Sports Golazo Network
- PGA Tour on CBS
- UEFA Champions League
- UEFA Europa League
- Italian Serie A
- Watch CBS Sports Network
- TV Shows & Listings
The Early Edge
A Daily SportsLine Betting Podcast
With the First Pick
NFL Draft recap
- Podcasts Home
- The First Cut Golf
- Beyond the Arc
- We Need to Talk Now
- Eye On College Basketball
- NFL Pick Six
- Cover 3 College Football
- Fantasy Football Today
- My Teams Organize / See All Teams Help Account Settings Log Out
2024 Wells Fargo Championship DFS: Optimal DraftKings, FanDuel daily Fantasy golf picks, lineups, strategy
Expert with over $2m in winnings gives pga dfs advice and 2024 wells fargo championship dfs strategy for draftkings and fanduel.
Building the perfect PGA DFS strategy for the 2024 Wells Fargo Championship will certainly be a difficult task. With golfers like Rory McIlroy, Xander Schauffele, Wyndham Clark and Jordan Spieth in the PGA DFS player pool, it's hard to determine which ones to include in your 2024 Wells Fargo Championship PGA DFS lineups. Clark is the defending champion of this event and he's already secured one win and four top-10 finishes this season.
Should Clark be part of your PGA DFS lineups for the Wells Fargo Championship 2024, or should you roster a lower-priced player like Jason Day, who won this event in 2018? Before you lock in your PGA DFS picks for the 2024 Wells Fargo Championship, you'll want to see the latest daily Fantasy golf picks, advice, and player pool from SportsLine's Mike McClure .
McClure is a DFS pro with over $2 million in career winnings, and he's been red-hot on his PGA Tour picks this season. McClure is also a predictive data engineer at SportsLine who uses a powerful prediction model that simulates every tournament 10,000 times, taking factors like statistical trends, past results, and current form into account. This allows him to find the best PGA DFS values and create optimal lineups that he shares only over at SportsLine. They're a must-see for any PGA DFS player.
Last week at the CJ Cup Byron Nelson, McClure included Alex Noren among his top PGA DFS picks. The result: Noren secured a third-place finish, returning 86 points on DraftKings and 92.9 points on FanDuel. Anybody who included him in their lineups was well on the way to a profitable weekend.
In addition, McClure's model is up more than $9,000 on its best bets since June 2020, nailing tournament after tournament. This same model has also nailed a whopping 11 majors entering the weekend, including three straight Masters. Anyone who has followed it has seen massive returns.
Now, McClure has set his sights on the 2024 Wells Fargo Championship and revealed his optimal PGA DFS advice, strategy, and player pool. Head to SportsLine now to see his top golf DFS picks for the Wells Fargo Championship 2024 .
Top 2024 Wells Fargo Championship PGA DFS picks
One of McClure's top PGA DFS picks for the Wells Fargo Championship 2024 is Will Zalatoris at $7,900 on DraftKings and $9,600 on FanDuel. Zalatoris has finished T-4 or better in two of his last three starts at a signature event, so confidently lock him in your PGA DFS lineups.
In order to score well at Quail Hollow, players will need to be extremely accurate off the tee, and few do it better than Zalatoris. The 27-year-old enters this week's event ranked 14th in driving accuracy percentage (71.69%). He's also been effective with an iron in his hands, ranking eighth in strokes gained: approach to green (0.694). Those impressive stats make Zalatoris a complete steal for your PGA DFS lineups at this price point.
McClure's optimal PGA DFS strategy also includes rostering Justin Thomas at $8,500 on DraftKings and $10,400 on FanDuel. Thomas enters this week's event full of confidence after finishing T-12 or better in five of his nine starts this season, which includes a T-5 showing at the RBC Heritage in his last outing.
The 31-year-old has all the tools needed to return solid value for your PGA DFS lineups this week at Quail Hollow. In fact, Thomas is currently ranked seventh in strokes gained: approach to green (0.712), eighth in birdie average (4.62) and 11th in putting average (1.710). Thomas has also racked up 15 career victories on the PGA Tour, proving he can provide value in a loaded 2024 Wells Fargo Championship field. See who else to back right here .
How to set 2024 Wells Fargo Championship DFS lineups
McClure is also targeting an undervalued player who's primed to play extremely well, giving you a huge return on sites like DraftKings and FanDuel. Picks like these could be the difference between winning your PGA DFS contests or going home with nothing. You can only see who it is here .
So what are the top PGA DFS picks for the Wells Fargo Championship 2024, and which undervalued golfer is a must-roster? Visit SportsLine now to see the complete 2024 Wells Fargo Championship DFS player pool for FanDuel and DraftKings, all from the expert who's made over $2 million in daily Fantasy sports , and find out.
Our Latest Golf Stories
2024 Wells Fargo Championship odds, picks, predictions
Cbs sports staff • 4 min read.
2024 Wells Fargo Championship expert picks, bets, odds
Cbs sports staff • 3 min read.
King Charles III accepts membership at St. Andrews
Patrick mcdonald • 1 min read.
Nelly Korda goes for record sixth straight LPGA win
Kyle porter • 3 min read, 2024 pga championship odds, picks, best bets, field, cbs sports staff • 5 min read.
Rory enters week as most dominant to play Quail Hollow
Share video.

2024 Wells Fargo Championship PGA DFS picks, lineups

Wells Fargo Championship preview, expert picks

Rory: Most dominant at Quail Hollow
Korda goes for record sixth straight win

Tiger Woods set to play 2024 PGA Championship

Ludvig Åberg (knee) withdraws from Wells Fargo

Tiger Woods accepts exemption for U.S. Open

Is Scheffler vs. McIlroy ahead at Valhalla?

Koepka eyes major history at PGA Championship

Åberg, Clark headline San Francisco's TGL team

Flag Hunting: PGA Betting Picks - 2024 Wells Fargo Championship
T he four names on this betting card are aimed at returning about 6.5 times our investment. Because of the inflated odds associated with the outright market, it becomes even more imperative to remain disciplined when setting your unit allocations from this article's picks. Golf outright betting is a notoriously fickle beast, and multiple month-long droughts are very much within the range of outcomes. However, at these prices, one single hit can pay off many weeks of poor decision-making.
In the two-year history at Flag Hunting, we've been fortunate enough to cash a total of 23 outright winners (a 20.7% hit rate) for a profit of over $15,000 (betting roughly $350 per week) and an aggregate ROI of 38.3%. The volatility of the sport means I can't promise you a winner in any given tournament. Still, suppose you're willing to bet methodically and stick with the process. In that case, the outright golf betting market has the potential to be one of the most profitable (and enjoyable) betting sweats in the business. But I suppose I'd better keep my word about the necessary rants, so with no further ado, here's every bet I've made for the 2024 Wells Fargo Championship!
2024 Wells Fargo Betting Card
Wyndham clark (18-1).
If Wyndham Clark is not going to get proper respect at a golf course he lapped the field by four just 12 months ago, it's difficult to forecast what it will take for books to start treating him like the third best player on the planet.
Despite three wins over his last 20 starts (at LACC, Pebble Beach, and Quail Hollow nonetheless), two runner-ups to Scottie Scheffler at Bay Hill and TPC Sawgrass, and an additional two third-place finishes both in his last start at Harbour Town and in last year's TOUR Championship, Clark still sits a clear tier behind Rory and Xander according to the bookmakers. I personally ran to the window to grab a piece at 18-1 after it was announced that Ludvig Aberg would be sitting out in Charlotte due to a knee issue, but even with Ludvig in attendance, I had a lot of interest in the ever-undervalued Clark.
It's difficult to find a better course fit for the Oregon product than this week either -- as the combination of Quail Hollow's distance-intensive, 7,600-yard layout, combined with recent rains that have softened up the fairways mean that his field-leading marks in both Ball Speed and Distance to Apex will make Wyndham's driver a weapon around the array of long Par 4s and 5s on this routing.
Wyndham also ranks second in my putting modeling when isolating for green complexes with similar speed and agronomy to Quail, and since the start of 2024, the long-iron game has become a true weapon for our 2023 U.S. Open Champion. Clark ranks in the 90th percentile for GIR % on approaches over 200 yards, and number one on the PGA Tour in Good Shot Percentage.
For whatever reason, books continue to price the World No. 3 as an afterthought in these marquee fields. I'm more than happy to endorse the 16/18-1s still available on market, and barring an unmitigated disaster over the next four days, the 28s currently posted in next week's future markets are worthy of strong consideration as well.
Sahith Theegala (33-1)
If Ludvig Aberg isn't destined to continue Quail Hollow's legacy of crowning the PGA Tour's future stars, I can think of no better candidate to take his place than Sahith Theegala. We've been banging this drum at Flag Hunting for most of this 2024 season, and this week, fresh off of a runner-up finish to the absentee Scottie Scheffler, I'm happy to take another shot at calling this kid's inevitable breakthrough.
It almost defies belief how quickly Sahith has turned a blatant deficiency in his game into one of his more bankable strengths -- as one year after ranking 134th on Tour in Strokes Gained: Off-the-Tee, Theegala now sits as the sixth best driver of the ball in this star-studded field over his last 36 rounds. For reference, this sample extends back to Round 1 of the Sentry Tournament of Champions this past January, and currently puts him right in between the likes of Wyndham Clark and Cameron Young off of the tee.
Combine this stunning development with the upside we've long identified in the rest of his game, and it becomes clear just how high the ceiling could be for this elite-driving version of Sahith Theegala:
- Leads this field in SG: Putting on Comparable Green Complexes
- Gained an average of 2.5 strokes putting per tournament over his last 20 starts (+2.9 over his last five)
- Gained at least three strokes on Approach in four of his last six PGA starts
- Third in this field in Good Shot % and Eight in Proximity from >200 yards (the last 12 months)
- Top 25 on Tour in SG: Around the Greens over the entire 2022-23 season
From Bay Hill and TPC Sawgrass, to Muirfield Village, Harbour Town, and Torrey Pines, Theegala has proven time and time again that his game is well suited for the biggest and brightest stages the PGA Tour has to offer. My numbers have him rated far above his current 33-1 price tag, and unless something drastic were to change in his underlying stats, this won't be the last time I make this case in a big-time event.
Did you know RotoBaller has a Premium DFS PGA subscription ? Like what you read today? You can show your support for Ian by using the discount code BALLER when purchasing a PGA Premium Pass . You get 10% off and full access to all of our Premium PGA articles, DFS tools, and Lineup Optimizer! You also get access to weekly betting picks from Spencer Aguiar, one of the top betting minds in the industry.
Tony Finau (35-1)
Speaking of trending off-the-tee breakthroughs, a recent change in equipment has seemingly put Tony Finau back amongst the ranks of the PGA Tour's elite drivers. Since changing to the GT version of his Mitsubishi Diamana driver shaft in March's Houston Open, Finau has gained a whopping 11.7 shots off of the tee in 12 subsequent rounds. He ranked 2nd and 3rd in Total Driving at the two more driver-intensive courses in that time (Memorial Park and Augusta National), and ranks 6th in this field in Driving Distance thus far in 2024.
Quail Hollow's collection of 480+ yard par fours should be a perfect venue for Tony to keep that driving rhythm going, and when you combine this recent driving form with one of the most compelling approach profiles in this field (1st in Long Iron Proximity, 2nd in SG/Shot, 4th in Good Shot Percentage), and a top 20 short game rating, and Finau becomes one of the week's top commodities in terms of expected tee-to-green performance.
His place as the 12th-15th name on odds boards does not fully encompass these recent ball-striking gains, and if we can truly count on him as an elite all-around driver of the ball, I think Tony isn't far away from taking back his place on the mantle of top names to watch at the Tour's most demanding venues. My numbers hold his in as high regard as anyone in this field after the top three, and I'm happy to take my shot at prices bordering on 40-1.
Viktor Hovland (50-1)
We end this week's pre-tournament betting card with a name for which I have very little to say about his lead-in form. Frankly, Viktor Hovland has been abysmal to start the 2024 season, and as the weeks go by and the disappointments mount, it becomes more and more difficult to write off these recent struggles as a fluke.
I will fully concede that there is a universe where we look back on this bet and laugh, but everybody has their price. For me, Viktor Hovland at 50-1 is where I draw the line -- particularly at a golf course as well suited to his skillset as Quail Hollow.
7,600 yards. Driving. Long-iron play. Difficult scoring conditions. If that's not a recipe for a Viktor Hovland resurgence, I'm not sure what is. Despite his horrid results over the last four months, Hovland still ranks out as a top 15 driver of the ball in this field. He ranks second in my long-term proximity model, and three years ago, Viktor put together the second best putting week of his season in a third-place finish around Quail Hollow.
Maybe the best argument that can be made for Hovland is the nearly full month off he's had after an embarrassing second round 81 at Augusta National. As someone who's watched Viktor's career unfold with great interest, that Friday afternoon felt as close to rock-bottom as it could possibly get. I like the fact that he took Harbour Town off, and if you know anything about Viktor, it's that he's putting in the work to get things right. If by chance he has stumbled on the correct formula over the last few weeks, his ascension back to the top of the game could come without warning.
In-Tournament Strategy
With these four names on the card, we're still left with ~20% of our weekly budget to use on in-tournament additions. This section will outline a few names to monitor in the live markets, as well as a few potential angles to use when assessing player viability over the course of the week.
- For those looking to dabble in the live market this week, it will be important to contextualize a player's position on the leaderboard alongside the holes he still has left to play. Fortunately for us, Quail Hollow makes a pretty clear distinction between birdie opportunities and holes where you can lap the field by treading water.
- Only five holes at Quail Hollow historically play under par, and once again, the scorecard tells us no tales in regards to which ones meet those criteria. The three Par 5's (5,10, and 15), all carry birdie or better rates over 33%, and two short Par 4's (8 and 14) play a combined (0.43) under par historically - with birdie or better rates of 27 and 35% respectively.
- Outside of those five holes, there aren't a ton of scoring opportunities to look forward to around Quail, as the remaining 13 holes play a combined 2.15 shots over par and exactly zero of them feature birdie rates over 13%.
- In particular, the holes to really be feared are 1, 6, 11, 16, 17, and 18. All of which carry a stroke average of at least 0.2 shots above par, with bogey or worse rates over 25%. That doesn't even include holes like 3, 9, 12, and 13, with bogey or worse rates over 20% and a mean stroke average of +0.15.
- Simply put, there aren't exactly many breather holes around Quail Hollow this week. Either you're stepping up to a potential eagle opportunity at one of the Par 5's or drivable Par 4s, or you're looking to hold on for dear life in a sea of 480-yard Par 4's and Par 3's
- I believe Par 5 scoring and Bogey Avoidance are of equal importance this week, as although there are only 3 Par 5's on the course, they represent such important scoring opportunities over the course of the round. Taking advantage of the "gimmes" available to you will be imperative, as anyone forced to make up ground elsewhere is in for some tough sledding.
- And finally, no Quail Hollow analysis would be complete without discussing the "Green Mile." A three-hole stretch from 16-18 that routinely ranks as one of the most difficult finishes on the PGA Tour. Combined, the three holes play to a stroke average of +0.8, and for those looking to add players in the live market, be sure to proceed with extreme caution if your intended target hasn't reached the 16th tee. Many dreams have been dashed within those 1200 yards.
Best of luck, guys, and happy hunting!
Win Big With RotoBaller
Our very own Joe Nicely recently took down a big DraftKings DFS tournament for the Travelers Championship. And as an encore, RotoBaller subscriber @tenndolly2 won $100K on FanDuel with the help of Joe and the rest of our Premium PGA team:
Golf DFS News and Player Outlooks
More pga analysis and dfs lineup picks.

IMAGES
VIDEO
COMMENTS
1 st • Nate Lashley. 79' 5". Putts made Distance. 1 st • Pierceson Coody. 57. Approach Putt Performance. 1 st • Matt Kuchar. 1' 9". Average Putting Distance - All 1 putts.
Vincent Norrman. 1.880. 668. 356. 356. Around the Web. Wondering who leads the PGA Tour in drive distance, consecutive cuts, scoring average, or putts per hole? CBS Sports has all of those ...
8 FEET. PGA Tour percentage: 52.86%. Context: Steven Adams was the worst free throw shooter in the NBA this season, staring down 292 tries from the line and converting 146, exactly half (50%). Bad ...
On average PGA Tour pros make 99% of 2-foot putts, 96% of 3-foot putts, 88% of 4-foot putts and 77% of 5-foot putts according to strokes gained pioneer, Mark Broadie. From 10 feet their one putt percentage is 40%, 23% from 15 feet, 15% from 20 feet, 7% from 30 feet, 4% from 40 feet, 3% from 50 feet and 2% from 60 feet.
1 st • Steve Stricker. 40.59%. Putts Per Round. 1 st • José María Olazábal. 26.83. Putts per Round - Round 1. 1 st • Bob Estes. 26.20. Putts per Round - Round 2.
Fortunately, the PGA Tour website has a dedicated stats section dedicated to this very metric. Throughout the 2022/2023 season, the average was around 41% - with 91 players falling short of that mark. ... In total, 101 players made the cut to post above average putting numbers from this distance, with only 29 achieving better than 50%. (Image ...
Overview Strokes Gained Off The Tee Approach the Green Around the Green Putting Scoring Streaks Money/Finishes Points/Rankings. Player. Course. Scoring Average. Scottie Scheffler. 68.743. Avg. 1 ...
On average, PGA Tour pros are known for their exceptional putting skills. According to strokes gained pioneer, Mark Broadie, they make an incredible 99% of 2-foot putts, 96% of 3-foot putts, 88% of 4-foot putts, and 77% of 5-foot putts. These statistics highlight just how accurate and consistent professional golfers are on the greens.
Only in one of 10 rounds do tour pros hole 100 percent of their putts from inside 10 feet. And most recently, in 2021/22, Tour pros made an average 99% of putts that were 3ft or less. The number dropped slightly for 4ft putts, to 92%, while 81% of 5ft putts were successful, and 70% of 6ft putts were holed. That falls to around 61% of 7ft putts ...
During a season in which he leads the PGA Tour in numerous ball-striking categories, the World No. 1 has been dreadful with the putter, ranking outside the top 145 in strokes gained/putting.
The average PGA Tour player makes a 10-foot putt on the first attempt 66.4% of the time. This percentage drops when the player is putting from the fringe (the area between the green and the rough), with the average PGA Tour player making a 10-foot putt from the fringe 59.3% of the time. The percentage drops even further when the player is ...
Annual Strokes Gained Putting Leaders on PGA Tour ... (Note that the PGA Tour officially calls this stat "Putting Average.") 2023 — Taylor Montgomery, 1.659 2022 — Cameron Smith, 1.679 2021 — Cameron Smith, 1.689 2020 — Webb Simpson, 1.691 2019 — Jordan Spieth, 1.694
Putting is an important 40 percent of the game at virtually every level of play. In 2016, the average PGA Tour player needed 29 putts to shoot their average score of 70.85 (41 percent of their strokes). The average 17-handicap golfer needs 34 putts to achieve their average score of 89 (38 percent). Clearly, not […]
Explained. Strokes gained putting is a golf statistic used by the PGA Tour that provides an objective measure of putting skill across golfers, courses, and tournaments. Whether you're trying to improve your golf game or maybe, just find an edge in your fantasy golf league, strokes gained putting is one of the most important stats you can look at.
"On the PGA Tour, the best putters [top 20] compared to the worst putters [ranked 140-160], the difference is about 0.9 strokes per round," Stagner said. "So the best putters are almost a ...
Looking at this stat will make the average golfer realize that having 30 putts or less per round is a very solid goal to strive towards instead of setting the goal at 36. Putts per round by handicap: Professional golfer = 28-32 putts. Scratch golfer = 30-34 putts. Average golfer = 36-40 putts. High handicap = 45+ putts.
From 25 feet or longer: 9.56%. For lots of amateur golfers, facing a putt outside of 30 feet means a three-putt is the most likely outcome. Granted, lumping every putt outside of 25 feet into one ...
This means a player putting from 30 feet would be expected to take on average 1.977 putts. So if a player happens to hole their 30-footer they have effectively gained a shot compared with the probability. There are a number of online calculators that will allow you to work out your strokes gained figure compared with the PGA Tour probabilities.
PGA TOUR, PGA TOUR Champions, and the Swinging Golfer design are registered trademarks. The Korn Ferry trademark is also a registered trademark, and is used in the Korn Ferry Tour logo with ...
TrackMan PGA Tour Average stats including Club speed, Attack Angle, Ball Speed, Smash Factor, Launch Angle, Spin Rate, Max Height, Land Angle and Carry. ... have greatly assisted me in understanding Flight/Ball dynamics and greatly assists my Coach and I in our 4-5 hour daily Putting-Wedge-Iron-Wood and Driver Sessions providing the data ...
The complete 2024 PGA TOUR Putts per hole rankings on ESPN. The full list of all PGA players ranked based on Putts per hole.
Wondering who leads the PGA Tour in drive distance, consecutive cuts, scoring average, or putts per hole? CBS Sports has all of those statistics and more for the PGA Tour.
On the PGA Tour, even the best in three-putt avoidance still three-putt from time to time. Wyndham Clark led the Tour in this statistical category in 2019, three-putting just 1.44% of the time.
PGA Tour on CBS; UEFA Champions League; UEFA Europa League; Italian Serie A; ... (4.62) and 11th in putting average (1.710). Thomas has also racked up 15 career victories on the PGA Tour, proving ...
Gained an average of 2.5 strokes putting per tournament over his last 20 starts (+2.9 over his last five) Gained at least three strokes on Approach in four of his last six PGA starts