UN Tourism | Bringing the world closer
The first global dashboard for tourism insights.
- UN Tourism Tourism Dashboard
- Language Services
- Publications

share this content
- Share this article on facebook
- Share this article on twitter
- Share this article on linkedin
UN Tourism Data Dashboard
The UN Tourism Data Dashboard – provides statistics and insights on key indicators for inbound and outbound tourism at the global, regional and national levels. Data covers tourist arrivals, tourism share of exports and contribution to GDP, source markets, seasonality and accommodation (data on number of rooms, guest and nights)
Two special modules present data on the impact of COVID 19 on tourism as well as a Policy Tracker on Measures to Support Tourism
The UN Tourism/IATA Destination Tracker
UN Tourism Recovery Tracker

- International tourist arrivals and receipts and export revenues
- International tourism expenditure and departures
- Seasonality
- Tourism Flows
- Accommodation
- Tourism GDP and Employment
- Domestic Tourism

International Tourism and COVID-19
- The pandemic generated a loss of 2.6 billion international arrivals in 2020, 2021 and 2022 combined
- Export revenues from international tourism dropped 62% in 2020 and 59% in 2021, versus 2019 (real terms) and then rebounded in 2022, remaining 34% below pre-pandemic levels.
- The total loss in export revenues from tourism amounts to USD 2.6 trillion for that three-year period.
- International tourist arrivals reached 88% of pre-pandemic levels in January-December 2023
COVID-19: Measures to Support Travel and Tourism
- Regional Support Office for Asia and the Pacific (RSOAP)
- Member States in Asia and the Pacific
- SUSTAINABLE TOURISM OBSERVATORIES (INSTO)

According to the first UNWTO World Tourism Barometer of the year, international tourism ended 2023 at 88% of pre-pandemic levels , with an estimated 1.3 billion international arrivals . The unleashing of remaining pent-up demand, increased air connectivity, and a stronger recovery of Asian markets and destinations, are expected to underpin a full recovery by the end of 2024 (UNWTO Tourism Barometer January 2024 – Press Release) .
An estimated 1286 million international tourists (overnight visitors) were recorded around the world in 2023, an increase of 34% over 2022. International tourism recovered 88% of pre-pandemic levels, supported by strong pent-up demand (UNWTO Tourism Barometer January 2024-Excerpt) .
International tourism is expected to fully recover pre-pandemic levels in 2024, with initial estimates pointing to 2% growth above 2019 levels. This central forecast by UNWTO remains subject to the pace of recovery in Asia and to the evolution of existing economic and geopolitical downside risks (UNWTO Tourism Barometer January 2024 – Press Release) .
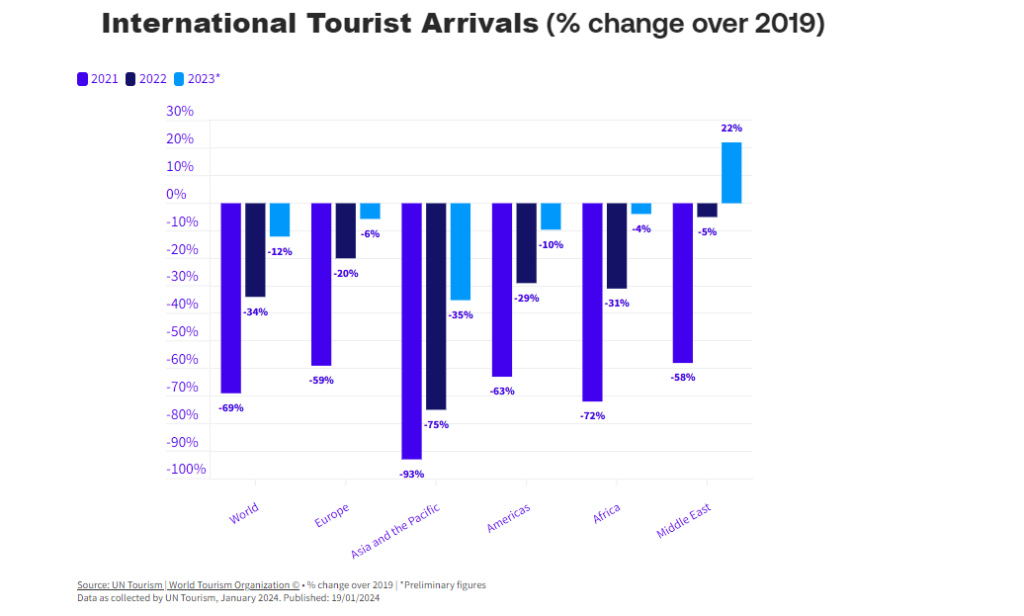
Asia and the Pacific reached 65% of pre-pandemic levels, with a gradual recovery since the start of 2023 following the reopening of several markets and destinations. However, performance among subregions were mixed, with South Asia recovering 87% of pre-pandemic levels and North-East Asia, 55% (UNWTO Tourism Barometer January 2024-Excerpt) .
There is still significant room for recovery across Asia. The recent reopening of several source markets and destinations is expected to boost recovery in the region and globally (UNWTO Tourism Barometer January 2024- Excerpt) .
Read more on the UNWTO Tourism Barometer (January 2024 excerpt) here .
About the UNWTO World Tourism Barometer
The UNWTO World Tourism Barometer is a publication of the World Tourism Organization (UNWTO) that monitors short-term tourism trends regularly to provide global tourism stakeholders with up-to-date analysis of international tourism. The information is updated several times a year and includes an analysis of the latest data on tourism destinations (inbound tourism) and source markets (outbound tourism). The Barometer also includes three times a year Confidence Index based on the UNWTO Panel of Tourism Experts survey, which provides an evaluation of recent performance and short-term prospects for international tourism.
Regional Support Office in Asia and the Pacific (RSOAP)
Rsoap a to z.
- Sustainable Tourism Observatories(INSTO)
UNWTO A to Z
- About UNWTO
- Affiliate Members
- Member States
- Tourism in the 2030 Agenda
- World Tourism Day
- Technical Cooperation
- ASIA AND THE PACIFIC
- MIDDLE EAST
- RESOURCES/SERVICES
- Sustainable Development of Tourism
- Ethics, Culture and Social Responsibility
- Market Intelligence
- Tourism Data Dashboard
- Publications
- UNWTO Academy
Partners links

© UNWTO Regional Support Office for Asia and the Pacific (RSOAP)
Interactive visualization requires JavaScript
Related research and data
- Promote sustained, inclusive and sustainable economic growth, full and productive employment and decent work for all
- Air passengers
- Air passengers per fatality
- Average length of stay of international visitors
- Employment in food and beverage serving activities per 1,000 people
- Employment in tourism-related industries per 1,000 people
- Fatal airliner accidents and hijacking incidents
- Fatal airliner accidents per million commercial flights
- Fatalities from airliner accidents and hijackings
- Foreign guests in hotels and similar establishments
- Global aviation fatalities per million passengers
- International one-day trips
- International one-day trips per 1,000 people
- International tourist departures
- International tourist departures per 1,000 people
- International tourist departures per 1,000 people vs. GDP per capita
- International tourist expenditure abroad
- International tourist expenditure within the country they visit
- International tourist trips by destination region
- International tourist trips by region of origin
- International tourist trips per 1,000 people
- International trips for business and professional reasons
- International trips for personal reasons
- International trips for personal vs. business and professional reasons
- Local guests in hotels and similar establishments
- Local vs. foreign guests in hotels and similar establishments
- Monitoring of sustainable tourism
- Monthly CO₂ emissions from commercial passenger flights
- Monthly CO₂ emissions from domestic and international commercial passenger flights
- Per capita CO₂ emissions from domestic commercial passenger flights
- Per capita CO₂ emissions from commercial aviation, tourism-adjusted
- Per capita CO₂ emissions from international commercial passenger flights, tourism-adjusted Clarke & UNWTO
- Per capita CO₂ emissions from international passenger flights, tourism-adjusted Graver & World Bank
- Ratio of business trips to trips for personal reasons
- Ratio of inbound to outbound tourist trips
- Ratio of same-day trips to tourist trips
- Share of global services exports
- Share of tourism in total GDP
- Trips by domestic tourists per 1,000 people
Our World in Data is free and accessible for everyone.
Help us do this work by making a donation.
These are the top 10 countries for travel and tourism

The US retains its prime position in the World Economic Forum's latest Travel & Tourism Development Index. Image: Unsplash/EveLazco
.chakra .wef-1c7l3mo{-webkit-transition:all 0.15s ease-out;transition:all 0.15s ease-out;cursor:pointer;-webkit-text-decoration:none;text-decoration:none;outline:none;color:inherit;}.chakra .wef-1c7l3mo:hover,.chakra .wef-1c7l3mo[data-hover]{-webkit-text-decoration:underline;text-decoration:underline;}.chakra .wef-1c7l3mo:focus,.chakra .wef-1c7l3mo[data-focus]{box-shadow:0 0 0 3px rgba(168,203,251,0.5);} Charlotte Edmond

.chakra .wef-1nk5u5d{margin-top:16px;margin-bottom:16px;line-height:1.388;color:#2846F8;font-size:1.25rem;}@media screen and (min-width:56.5rem){.chakra .wef-1nk5u5d{font-size:1.125rem;}} Get involved .chakra .wef-9dduvl{margin-top:16px;margin-bottom:16px;line-height:1.388;font-size:1.25rem;}@media screen and (min-width:56.5rem){.chakra .wef-9dduvl{font-size:1.125rem;}} with our crowdsourced digital platform to deliver impact at scale
- Pent-up demand after the pandemic is expected to drive passenger numbers back up to pre-pandemic levels in 2024.
- The recovery of the travel and tourism sector since the pandemic has been uneven, however, and some nations are better placed than others to respond to the challenges and opportunities of the future.
- The top three best-placed countries for travel and tourism are the US, Spain and Japan, according to the World Economic Forum’s Travel & Tourism Development Index.
If you were desperate to get away after the restrictions and enforced staying at home of the pandemic years, you were far from alone.
Global international tourist arrivals are expected to meet pre-pandemic levels in 2024 driven by this pent-up demand. But, the recovery of the travel and tourism sector since the pandemic has not been without challenges. Add to that macroeconomic, geopolitical and environmental factors, which have added pressures on the industry.
These pressures will amplify and evolve over the coming years and, along with the growth of digital technologies and AI, may well force the travel industry to adapt.
Some economies are better placed than others to make these changes, respond to future risks and ensure that travel and tourism is a driver of economic growth and prosperity.
With this in mind, the World Economic Forum’s Travel & Tourism Development Index (TTDI) aims to serve as a benchmark for stakeholders to gauge progress, inform decisions and policies, and encourage sustainable and resilient growth.
A mixed recovery in challenging conditions
Europe dominates the top 10 economies for T&T, as ranked by the 2023 index, although the top spot is clinched by the US.

But the index also shows that while 71 of the 119 economies it ranks improved their scores between 2019 and 2023, the average improvement is just 0.7% above pre-pandemic levels.
On the one hand, the rebound in travel and tourism has coincided with rising global air route capacity and connectivity, improved international openness, and increased investment in natural and cultural resources driving tourism. On the other hand, non-leisure demand is still lagging, there are ongoing labour shortages, and air route capacity and connectivity, capital investment and productivity have struggled to keep pace with demand.
This has created a supply and demand imbalance which, along with inflationary pressures, has led to reduced price competitiveness and service disruptions.

Europe and Asia-Pacific have the most favourable conditions
Of the top 30 TTDI scorers in 2023, 26 are high-income countries. Nineteen of them are based in Europe, and seven in Asia Pacific.
These countries benefit from favourable business environments and labour markets, open travel policies, advanced technology adoption, excellent transport and tourism infrastructure, and rich natural, cultural and non-leisure attractions.
As a result, this group of 30 accounted for more than three-quarters of T&T industry GDP in 2022, and 70% of GDP growth between 2020 and 2022.

But although this group is leading the way, many of the above-average improvements in scores come from low- to upper-middle-income countries, including sub-Saharan and North Africa, Eurasia, South America, South Asia, and the Balkans and Eastern Europe.
While many have shown improvements, these less affluent countries still make up the vast majority of below-average scorers in the index. More investment is needed to help increase their share of the market and improve their readiness for future risks and opportunities.
Progress needed on resilience and equality
The ability of the travel and tourism sector to grow is limited by challenges like tight labour markets, growing fiscal constraints and concerns around health and security conditions. Labour market resilience will be an increasingly important factor for the sector, but issues like equality of job opportunities, workers’ rights and social protection are holding many economies – particularly low- and middle-income ones – back in this area.
As other sectors proceed to decarbonize, the aviation sector could account for a much higher share of global greenhouse gas emissions by mid-century than its 2%-3% share today.
Sustainable aviation fuels (SAF) can reduce the life-cycle carbon footprint of aviation fuel by up to 80%, but they currently make up less than 0.1% of total aviation fuel consumption. Enabling a shift from fossil fuels to SAFs will require a significant increase in production, which is a costly investment.
The Forum’s Clean Skies for Tomorrow (CST) Coalition is a global initiative driving the transition to sustainable aviation fuels as part of the aviation industry’s ambitious efforts to achieve carbon-neutral flying.
The coalition brings together government leaders, climate experts and CEOs from aviation, energy, finance and other sectors who agree on the urgent need to help the aviation industry reach net-zero carbon emissions by 2050.
The coalition aims to advance the commercial scale of viable production of sustainable low-carbon aviation fuels (bio and synthetic) for broad adoption in the industry by 2030. Initiatives include a mechanism for aggregating demand for carbon-neutral flying, a co-investment vehicle and geographically specific value-chain industry blueprints.
Learn more about the Clean Skies for Tomorrow Coalition's impact and contact us to find out how you can get involved.
Another major hurdle for the sector is balancing growth with sustainability. Although there has been broad progress in areas like energy sustainability, some progress – like the fall in emissions seen during the pandemic – is likely to only be temporary.
Have you read?
What is overtourism and how can we overcome it , rising global temperatures are already affecting the tourism industry - here's how, don't miss any update on this topic.
Create a free account and access your personalized content collection with our latest publications and analyses.
License and Republishing
World Economic Forum articles may be republished in accordance with the Creative Commons Attribution-NonCommercial-NoDerivatives 4.0 International Public License, and in accordance with our Terms of Use.
The views expressed in this article are those of the author alone and not the World Economic Forum.
The Agenda .chakra .wef-n7bacu{margin-top:16px;margin-bottom:16px;line-height:1.388;font-weight:400;} Weekly
A weekly update of the most important issues driving the global agenda
.chakra .wef-1dtnjt5{display:-webkit-box;display:-webkit-flex;display:-ms-flexbox;display:flex;-webkit-align-items:center;-webkit-box-align:center;-ms-flex-align:center;align-items:center;-webkit-flex-wrap:wrap;-ms-flex-wrap:wrap;flex-wrap:wrap;} More on Energy Transition .chakra .wef-17xejub{-webkit-flex:1;-ms-flex:1;flex:1;justify-self:stretch;-webkit-align-self:stretch;-ms-flex-item-align:stretch;align-self:stretch;} .chakra .wef-nr1rr4{display:-webkit-inline-box;display:-webkit-inline-flex;display:-ms-inline-flexbox;display:inline-flex;white-space:normal;vertical-align:middle;text-transform:uppercase;font-size:0.75rem;border-radius:0.25rem;font-weight:700;-webkit-align-items:center;-webkit-box-align:center;-ms-flex-align:center;align-items:center;line-height:1.2;-webkit-letter-spacing:1.25px;-moz-letter-spacing:1.25px;-ms-letter-spacing:1.25px;letter-spacing:1.25px;background:none;padding:0px;color:#B3B3B3;-webkit-box-decoration-break:clone;box-decoration-break:clone;-webkit-box-decoration-break:clone;}@media screen and (min-width:37.5rem){.chakra .wef-nr1rr4{font-size:0.875rem;}}@media screen and (min-width:56.5rem){.chakra .wef-nr1rr4{font-size:1rem;}} See all

The small island states making big strides towards 100% renewable energy
Michelle DeFreese
May 31, 2024

What is energy literacy and why is it important? Malaysia’s programme sees the potential
Olivia Zeydler
May 29, 2024

How solar thermal trapping paves way for sustainable metal smelting
Paige Bennett
May 27, 2024

'Every fraction of a degree matters': Why climate action needs a new narrative

How India is emerging as an advanced energy superpower
Maciej Kolaczkowski, Debmalya Sen and Jeremy Williams

How MENA’s biggest actors can help the region’s suppliers and SMEs to decarbonize
Akram Alami and Kelsey Goodman
Now boarding: Faces, places, and trends shaping tourism in 2024
After falling by 75 percent in 2020, travel is on its way to a full recovery by the end of 2024. Domestic travel is expected to grow 3 percent annually and reach 19 billion lodging nights per year by 2030. 1 Unless otherwise noted, the source for all data and projections is Oxford Economics. Over the same time frame, international travel should likewise ramp up to its historical average of nine billion nights. Spending on travel is expected to follow a similar trajectory, with an estimated $8.6 trillion in traveler outlays in 2024, representing roughly 9 percent of this year’s global GDP.
About the authors
This article is a collaborative effort by Caroline Tufft , Margaux Constantin , Matteo Pacca , and Ryan Mann , with Ivan Gladstone and Jasperina de Vries, representing views from McKinsey’s Travel, Logistics & Infrastructure Practice.
There’s no doubt people still love to travel and will continue to seek new experiences in new places. But where will travelers come from, and where will they go? We developed a snapshot of current traveler flows, along with estimates for growth through 2030. For the purposes of this report, we have divided the world into four regions—the Americas, Asia, Europe, and the Middle East and Africa.
Our analysis identifies three major themes for industry stakeholders to consider:
- The bulk of travel spending is close to home. Stakeholders should ensure they capture the full potential of domestic travel before shifting their focus to international travelers. And they should start with international travelers who visit nearby countries—as intraregional trips represent the largest travel segment after domestic trips.
- Source markets are shifting. Although established source markets continue to anchor global travel, Eastern Europe, India, and Southeast Asia are all becoming fast-growing sources of outbound tourism.
- The destinations of the future may not be the ones you imagine. Alongside enduring favorites, places that weren’t on many tourists’ maps are finding clever ways to lure international travelers and establish themselves as desirable destinations.
The bulk of travel spending is close to home
International travel might feel more glamorous, but tourism players should not forget that domestic travel still represents the bulk of the market, accounting for 75 percent of global travel spending (Exhibit 1). Domestic travel recovered from the COVID-19 pandemic faster than international travel, as is typical coming out of downturns. And although there has been a recent boom in “revenge travel,” with travelers prioritizing international trips that were delayed by the pandemic, a return to prepandemic norms, in which domestic travel represents 70 percent of spending, is expected by 2030.
The United States is the world’s largest domestic travel market at $1 trillion in annual spending. Sixty-eight percent of all trips that start in the United States remain within its borders. Domestic demand has softened slightly, as American travelers return abroad. 2 Dawit Habtemariam, “Domestic U.S. tourism growth levels off as Americans head overseas,” Skift, August 18, 2023. But tourism players with the right offerings are still thriving: five national parks broke attendance records in 2023 (including Joshua Tree National Park, which capitalized on growing interest from stargazers indulging in “dark sky” tourism 3 Scott McConkey, “5 national parks set attendance records in 2023, and the reasons may surprise you,” Wealth of Geeks, April 16, 2024. ).
China’s $744 billion domestic travel market is currently the world’s second largest. Chinese travelers spent the pandemic learning to appreciate the diversity of experiences on offer within their own country. Even as borders open back up, Chinese travelers are staying close to home. And domestic destinations are benefiting: for example, Changchun (home to the Changchun Ice and Snow Festival) realized 160 percent year-on-year growth in visitors in 2023. 4 Shi Xiaoji, “Why don’t Chinese people like to travel abroad anymore? The global tourism industry has lost 900 billion yuan. What is the situation?,” NetEase, February 12, 2024. In 2024, domestic travel during Lunar New Year exceeded prepandemic levels by 19 percent.
China’s domestic travel market is expected to grow 12 percent annually and overtake the United States’ to become the world’s largest by 2030. Hotel construction reflects this expectation: 30 percent of the global hotel construction pipeline is currently concentrated in China. The pipeline is heavily skewed toward luxury properties, with more than twice as many luxury hotels under construction in China as in the United States.
India, currently the world’s sixth-largest domestic travel market by spending, is another thriving area for domestic travel. With the subcontinent’s growing middle class powering travel spending growth of roughly 9 percent per year, India’s domestic market could overtake Japan’s and Mexico’s to become the world’s fourth largest by 2030. Domestic air passenger traffic in India is projected to double by 2030, 5 Murali Krishnan, “Can India’s airports cope with rapid passenger growth?,” Deutsche Welle, February 7, 2024. boosted in part by a state-subsidized initiative that aims to connect underserved domestic airports. 6 “India is seeing a massive aviation boom,” Economist , November 23, 2023.
When travelers do go abroad, they often stay close to home (Exhibit 2).
Europe and Asia, in particular, demonstrate strong and growing intraregional travel markets.
Recognizing this general trend, stakeholders have been funneling investment toward regional tourism destinations. An Emirati wealth fund, for instance, has announced its intent to invest roughly $35 billion into established hospitality properties and development opportunities in Egypt. 7 Michael Gunn and Mirette Magdy, “UAE’s $35 billion Egypt deal marks Gulf powers’ buying spree,” Bloomberg, April 27, 2024.
Europe has long played host to a high share of intraregional travel. Seventy percent of its travelers’ international trips stay within the region. Europe’s most popular destinations for intraregional travelers are perennial warm-weather favorites—Spain (18 percent), Italy (10 percent), and France (8 percent)—with limited change to these preferences expected between now and 2030.
Despite longer travel distances between Asian countries, Asia’s intraregional travel market is beginning to resemble Europe’s. Intraregional travel currently accounts for about 60 percent of international trips in Asia—a share expected to climb to 64 percent by 2030. As in Europe in past decades, Asian intraregional travel is benefiting from diminishing visa barriers and the development of a low-cost, regional flight network.
Thailand is projected to enjoy continued, growing popularity with Asian travelers. Thailand waived visa requirements for Chinese tourists in 2023 and plans to do the same for Indian tourists starting in 2024. It has aggressively targeted the fast-growing Indian traveler segment, launching more than 50 marketing campaigns directed at Indians over the past decade. The investment may be paying off: Bangkok recently overtook Dubai as the most popular city destination for Indian tourists. 8 “Bangkok overtakes Dubai as top destination for Indians post visa relaxation, reveals Agoda,” PR Newswire, January 18, 2024.
A McKinsey ConsumerWise survey on consumer sentiment, conducted in February 2024, suggests that Chinese travelers are also exhibiting high interest in international travel, with 36 percent of survey respondents indicating that they intend to spend more on international travel in the next three months. 9 Daniel Zipser, “ China brief: Consumers are spending again (outside of China) ,” McKinsey, April 8, 2024. Much of this interest is directed toward regional destinations such as Southeast Asia and Japan, with interest in travel to Europe down from previous years. 10 Guang Chen, Zi Chen, Steve Saxon, and Jackey Yu, “ Outlook for China tourism 2023: Light at the end of the tunnel ,” McKinsey, May 9, 2023.
Given travelers’ preference for proximity, how can tourism stakeholders further capitalize on domestic and intraregional travel demand? Here are a few strategies:
- Craft offerings that encourage domestic tourists to rediscover local gems. Destinations, hotels, and transportation providers can encourage domestic tourists to integrate lesser-known cultural landmarks into their trips to visit friends and relatives. In France, the upscale hotel chain Relais & Châteaux markets historic properties that lie far from classic tourist sights—such as Château Saint-Jean in rural Auvergne—as a welcome escape from the bustle of Paris. In Mexico, the Pueblos Mágicos program has successfully boosted domestic tourist visits to a set of “magical towns” that showcase Mexican heritage.
- Fold one-off domestic destinations into fuller itineraries. Route 66 in the United States is a classic road trip pathway, which spurs visits to attractions all along the highway’s length. Tourism stakeholders can collaborate to create similar types of domestic itineraries around the world. For instance, Mexico has expanded on its Pueblos Mágicos concept by branding coordinated visits to multiple villages as “magical routes.” In France, local tourism boards and vineyards have collaborated to promote bucket list “wine routes” around the country.
- Make crossing borders into neighboring countries seamless. Removing logistical barriers to travel can nudge tourists to upgrade a one-off trip to a single attraction into a bucket list journey across multiple, less-trodden destinations. In Africa, for example, Ethiopian Airlines is facilitating cross-border travel to major regional tourist sites through improved air connectivity. In Asia, Thailand has announced its intent to create a joint visa easing travel among Cambodia, Laos, Malaysia, Myanmar, Thailand, and Vietnam.
Source markets are shifting
The United States, Germany, the United Kingdom, China, and France remain the world’s five largest sources of travelers, in that order. These countries collectively accounted for 38 percent of international travel spending in 2023 and are expected to remain the top five source markets through 2030. But interest in travel is blossoming in other parts of the world—causing a shift in the balance of outbound travel flows (Exhibit 3).
North Americans’ travel spending is projected to hold steady at roughly 3 percent annual growth. US consumers voice growing concerns about inflation, and the most cost-constrained traveler segments are reducing travel, which is affecting ultra-low-cost airlines and budget hotels. Most travelers, however, plan to continue traveling: McKinsey research suggests that American consumers rank international and domestic travel as their highest-priority areas for discretionary spending. Instead of canceling their trips, these consumers are adapting their behavior by traveling during off-peak periods or booking travel further in advance. Travel spending by Europeans paints a slightly rosier picture, with roughly 5 percent projected annual growth. Meanwhile, the projected 12 percent annual growth in Chinese travelers’ spending should anchor substantial increases in travel spending across Northeast Asia.
Alongside these enduring traveler segments, new groups of travelers are emerging. Eastern Europe, India, and Southeast Asia are still comparatively small source markets, but they are developing fast-growing pools of first-time tourists (Exhibit 4).
India’s breakneck GDP growth of 6 percent year over year is bolstering a new generation of travelers, 11 Benjamin Laker, “India will grow to become the world’s third-largest economy by 2027,” Forbes , February 23, 2024. resulting in a projected annual growth in travel spending of 9 percent between now and 2030. Indian air carriers and lodging companies are making substantial investments to meet projected demand. Budget airline IndiGo placed the largest aircraft order in commercial aviation history in 2023, when it pledged to buy 500 Airbus A320 planes 12 Anna Cooban, “Biggest plane deal in history: Airbus clinches massive order from India’s IndiGo,” CNN, June 19, 2023. ; that same week, Air India nearly equaled IndiGo’s order size with purchase agreements for 250 Airbus and 220 Boeing jets. IndiGo later added an order for 30 additional Airbus A350 planes, well suited to serving both domestic and international routes. 13 “Airbus confirms IndiGo's A350 aircraft order,” Economic Times , May 6, 2024. The Indian Hotels Company Limited is ramping up its hotel pipeline, aiming to open two new hotels per month in the near future. International players are not sitting on the sidelines: seven hotel chains are launching new brands in India in 2024, 14 Peden Doma Bhutia, “Indian Hotels expansion plans: 2 new brands launching, 2 hotels opening every month,” Skift, February 2, 2024. including Marriott’s first Moxy- and Tribute-branded hotels in India and entrants from Hilton’s Curio and Tapestry brands. 15 Forum Gandhi, “Check-in frenzy: International hotel giants unleash fresh brands in India’s booming hospitality landscape,” Hindu Businessline , February 13, 2024. Development focus has shifted away from major metropolises such as Mumbai and Delhi and toward fast-developing, smaller cities such as Chandigarh and Hyderabad.
Southeast Asian travel spending is projected to grow at roughly 7 percent per year. Pockets of particularly high growth exist in Cambodia, Malaysia, and the Philippines. To capitalize on this blossoming source market, neighboring countries are rolling out attractive visa arrangements: for example, China has agreed to reciprocal visa waivers for short-term travelers from Malaysia, Singapore, and Thailand. 16 Julienna Law, “China launches ‘visa-free era’ with Southeast Asia. Will travel retail boom?,” Jing Daily , January 30, 2024.
Travel spending by Eastern Europeans is expected to grow at 7 percent per year until 2030—two percentage points higher than spending by Western Europeans. Areas of especially high growth include the Czech Republic, Hungary, and Poland, where middle-class travelers are increasingly venturing farther afield. Major tourism players, including the TUI Group, have tapped into these new source markets by offering charter flights to warm-weather destinations such as Egypt. 17 Hildbrandt von Klaus, “TUI develops Czech Republic as a new source market,” FVW, December 22, 2023.
Although the number of travelers from these new source markets is growing, their purchasing power remains relatively limited. Compared with Western European travelers (who average $159 per night in total travel spending), South Asians spend 20 percent less, Eastern Europeans spend 40 percent less, and Southeast Asians spend 55 percent less. Only 3 percent of the current Asian hotel construction pipeline caters to economy travelers, suggesting a potential supply gap of rooms that could appeal to budget-constrained tourists.
While acknowledging that historical source markets will continue to constitute the bulk of travel spending, tourism players can consider actions such as these to capitalize on growing travel demand from newer markets:
- Reduce obstacles to travel. Countries can look for ways to strategically invest in simplifying travel for visitors from growing source markets. In 2017, for example, Azerbaijan introduced express processing of electronic visas for Indian visitors; annual arrivals from India increased fivefold in two years. Requirements regarding passport photocopies or in-person check-ins can similarly be assessed with an eye toward reducing red tape for travelers.
- Use culturally relevant marketing channels to reach new demographics. Unique, thoughtful marketing strategies can help destinations place themselves on first-time travelers’ bucket lists. For example, after the release of Zindagi Na Milegi Dobara , a popular Bollywood movie shot in Spain with support from the Spanish Ministry of Tourism, Indian tourism to Spain increased by 65 percent. 18 “ Zindagi Na Milegi Dobara part of syllabus in Spain colleges,” India Today , June 6, 2004.
- Give new travelers the tech they expect. Travelers from newer source markets often have access to tech-forward travel offerings. For example, Indian travelers can travel anywhere within their country without physical identification, thanks to the Digi Yatra app. The Southeast Asian rideshare app Grab has several helpful travel features that competitors lack, such as automated menu translation and currency conversion. Tourism stakeholders should consider how to adapt to the tech expectations of newer travelers, integrating relevant offerings that ease journeys.
- Create vibrant experiences tailored to different price points. Crafting lower-budget offerings for more cost-constrained travelers doesn’t need to result in giving them a subpar experience. Capsule hotels, in which guests sleep in small cubbies, began as a response to the high cost of accommodations in Japan, but they have become an attraction in their own right—appearing on many must-do lists. 19 Philip Tang, “24 of the best experiences in Japan,” Lonely Planet, March 23, 2024.
The places you’ll go: The destinations of the future may not be the ones you imagine
The world’s top ten destination countries (the United States, Spain, China, France, Saudi Arabia, Türkiye, Italy, Thailand, Japan, and India, in that order) currently receive 45 percent of all travel spending, including for domestic travel. But some new locales are gaining traction (Exhibit 5).
A significant number of travelers are expanding their horizons, booking journeys to less visited countries that are near to old standbys. For instance, Laos and Malaysia, which both border Thailand—an established destination that is home to Bangkok, the world’s most visited city 20 Katherine LaGrave, “This is the world’s most visited city,” AFAR , January 31, 2024. —are up a respective 20 percent and 17 percent, respectively, in year-over-year international travel spending.
The world’s top ten destination countries currently receive 45 percent of all travel spending, including domestic-travel spending. But some new locales are gaining traction.
Several other countries that have crafted thoughtful tourism demand generation strategies—such as Peru, the Philippines, Rwanda, and Vietnam—are also expected to reap benefits in the coming years. Vietnam logged a remarkable 40 percent increase in tourism spending in the five years before the pandemic. Postpandemic, it has rebounded in part by waiving visa requirements for European travelers (while indicating intent to offer similar exemptions in the future for Chinese and Indian travelers). 21 Ashvita Singh, “Vietnam looks to offer visa-free entry to Indians: India report,” Skift, November 20, 2023. The Philippines has made a concerted effort to shift its sun-and-beach branding toward a more well-rounded image, replacing its long-standing “It’s more fun in the Philippines” tourism slogan with “Love the Philippines.” Peru is highlighting less visited archeological sites while also marketing itself as a top-notch culinary destination through the promotion of Peruvian restaurants abroad. Rwanda is investing in infrastructure to become a major African transit hub, facilitated by Qatar Airways’ purchase of a 60 percent stake in the country’s major airport. 22 Dylan Cresswell, “Rwanda plots ambitious tourism recovery,” African Business , July 28, 2022. Rwanda has also successfully capitalized on sustainable tourism: by charging $1,500 per gorilla trekking permit, for instance, it has maximized revenue while reducing environmental impact.
Tourism players might consider taking some of these actions to lure tourists to less familiar destinations:
- Collaborate across the tourism ecosystem. Promotion is not solely the domain of destination marketing organizations. Accommodation, transportation, and experience providers can also play important roles. In Singapore, for instance, the luxury resort Marina Bay Sands partners extensively with Singapore Airlines and the Singapore Tourism Board to offer compelling tourism offerings. Past collaborations have included flight and stay packages built around culinary festivals and a Lunar New Year drone show. 23 “Singapore Tourism Board, Marina Bay Sands & UOB partner to enliven Marina Bay precinct,” Singapore Tourism Board news release, January 25, 2024.
- Use infrastructure linkage to promote new destinations. By extending route options, transportation providers can encourage visitors to create itineraries that combine familiar destinations with new attractions. In Asia, Thailand’s tourism authority has attempted to nudge visitors away from the most heavily trafficked parts of the country, such as Bangkok and Phuket, and toward less popular destinations.
- Deploy social media to reach different demographics. Innovative social media campaigns can help put a destination on the map. Australia launched its “Ruby the kangaroo” campaign in China to coincide with the return of postpandemic air capacity between the two places. A video adapted for Chinese context (with appropriate gestures and a hashtag in Mandarin) garnered more than 20 million views in a single day on one of China’s largest social media platforms. 24 Nicole Gong, “Can Ruby the kangaroo bring Chinese tourists hopping back to Australia?,” SBS, June 5, 2023.
- Embrace unknown status. “Off the beaten path” messaging can appeal to widely traveled tourists seeking fresh experiences. Saudi Arabia’s “#WhereInTheWorld” campaign promoted the country’s tourist spots by acknowledging that they are less familiar to travelers, using a series of images that compared these spots with better-known destinations.
As tourism stakeholders look to the future, they can take steps to ensure that they continue to delight existing travelers while also embracing new ones. Domestic and intraregional tourism remain major opportunities—catering to local tourists’ preferences while building infrastructure that makes travel more seamless within a region could help capture them. Creative collaboration among tourism stakeholders can help put lesser-known destinations on the map. Travel tides are shifting. Expertly navigating these currents could yield rich rewards.
Caroline Tufft is a senior partner in McKinsey’s London office, Margaux Constantin is a partner in the Dubai office, Matteo Pacca is a senior partner in the Paris office, Ryan Mann is a partner in the Chicago office, Ivan Gladstone is an associate partner in the Riyadh office, and Jasperina de Vries is an associate partner in the Amsterdam office.
The authors wish to thank Abdulhadi Alghamdi, Alessandra Powell, Alex Dichter, Cedric Tsai, Diane Vu, Elisa Wallwitz, Lily Miller, Maggie Coffey, Nadya Snezhkova, Nick Meronyk, Paulina Baum, Peimin Suo, Rebecca Stone, Sarah Fellay, Sarah Sahel, Steffen Fuchs, Steffen Köpke, Steve Saxon, Sophia Wang, and Urs Binggeli for their contributions to this article.
This article was edited by Seth Stevenson, a senior editor in the New York office.
Explore a career with us
Related articles.

The future of tourism: Bridging the labor gap, enhancing customer experience

The promise of travel in the age of AI

From India to the world: Unleashing the potential of India’s tourists
Queensland looks to Bluey and Robert Irwin to boost tourist numbers
- In short: Queensland launches a new tourism campaign led by Bluey and Robert Irwin
- Ads will air in Australia, as well as New Zealand, United States, United Kingdom, Japan and Singapore
- The campaign's based on the theme of "keepy uppy", one of Bluey's favourite games
The Queensland government is tapping into the global popularity of local sensation Bluey with its biggest tourism campaign in a decade, built around the game of "keepy uppy".
The theme borrows from an episode of the hit show that first aired in 2018, when Bluey and Bingo took turns in keeping a red balloon from touching the ground.
The $9.2 million campaign —"Bluey's world, for real life" — features images from the state's 13 tourist hotspots including Brisbane, the Gold Coast, the Sunshine Coast and the Great Barrier Reef.
Robert Irwin, from Australia Zoo, fronts the television advertisement, inviting viewers to "come play".
The online campaign is expected to reach New Zealand, United States, United Kingdom, Japan and Singapore — markets where the blue heeler family is popular.
The government's hoping to attract an extra 1.3 million holidaymakers to the state by June 2025 — both from interstate and worldwide — spending an extra $1.7 billion.
Launching the campaign on Sunday, Premier Steven Miles touted the state's "best lifestyle, best beaches, "best cities".
"For the past six years, Bluey and the backdrop of Brisbane has captivated audiences globally and now it's time to bring the world here to Queensland — Bluey's world for real life," Mr Miles said.
When asked what he likes most about Bluey, Mr Miles said: "I just love how much fun they have. Sometimes I watch that and wish I was a bit more fun like Bluey's dad."
Bluey is available in 60 countries, including the United States, the UK and China. It was co-produced by the ABC and BBC Studios, which has the international broadcast and commercial rights.
To hammer home the concept, the launch was accompanied by a world record attempt for the biggest game of "keepy uppy" — an easy target as no similar attempts have been made.
(In 2020, serial record breaker David Rush kept three balloons in the air for a record one hour, 12 minutes and 50 seconds, beating the previous record by over half an hour, according to Guinness World Records).
Post-Covid travel rebound
Queensland tourist numbers have rebounded since the state opened its borders after the pandemic, with most international visitors from New Zealand and the United Kingdom.
China was Queensland's most-lucrative market before the pandemic, but that market has been slow to recover after an extended ban on outbound travel amid an economic downturn.
Tourism and Events Queensland CEO Patricia O'Callaghan said the state's tourism numbers were "solid" compared to other states, but some metrics were "softening".
"We know that cost of living is changing decisions, so we have to work even harder to put Queensland top of mind when it comes to being a holiday destination," Ms O'Callaghan said.
Another attempt to capitalise on the popularity of Bluey is set to open in November.
Bluey's World promises visitors an immersive experience , with soundscape interactive play features and guided experiences.
Tourism and Events Queensland expects the attraction to generate more than $18 million for the visitor economy.
- X (formerly Twitter)
Related Stories
Charlie is selling lemonade to save up for a boat, and the skills he's learning could help set him up for life.
For five years I've been living my best Bluey life — I'm not ready for it to end
'Like being in a Bluey episode': Bluey's World set to open in Queensland
Bluey's ode to backyard cricket a perfect lesson on what the game is about
- State and Territory Government
- Tourism and Leisure Industry
- Travel and Tourism (Lifestyle and Leisure)
Travel, Tourism & Hospitality
Global tourism industry - statistics & facts
What are the leading global tourism destinations, digitalization of the global tourism industry, how important is sustainable tourism, key insights.
Detailed statistics
Total contribution of travel and tourism to GDP worldwide 2019-2033
Number of international tourist arrivals worldwide 1950-2023
Global leisure travel spend 2019-2022
Editor’s Picks Current statistics on this topic
Leading global travel markets by travel and tourism contribution to GDP 2019-2022
Travel and tourism employment worldwide 2019-2033
Further recommended statistics
- Basic Statistic Total contribution of travel and tourism to GDP worldwide 2019-2033
- Basic Statistic Travel and tourism: share of global GDP 2019-2033
- Basic Statistic Leading global travel markets by travel and tourism contribution to GDP 2019-2022
- Basic Statistic Global leisure travel spend 2019-2022
- Premium Statistic Global business travel spending 2001-2022
- Premium Statistic Number of international tourist arrivals worldwide 1950-2023
- Basic Statistic Number of international tourist arrivals worldwide 2005-2023, by region
- Basic Statistic Travel and tourism employment worldwide 2019-2033
Total contribution of travel and tourism to gross domestic product (GDP) worldwide in 2019 and 2022, with a forecast for 2023 and 2033 (in trillion U.S. dollars)
Travel and tourism: share of global GDP 2019-2033
Share of travel and tourism's total contribution to GDP worldwide in 2019 and 2022, with a forecast for 2023 and 2033
Total contribution of travel and tourism to GDP in leading travel markets worldwide in 2019 and 2022 (in billion U.S. dollars)
Leisure tourism spending worldwide from 2019 to 2022 (in billion U.S. dollars)
Global business travel spending 2001-2022
Expenditure of business tourists worldwide from 2001 to 2022 (in billion U.S. dollars)
Number of international tourist arrivals worldwide from 1950 to 2023 (in millions)
Number of international tourist arrivals worldwide 2005-2023, by region
Number of international tourist arrivals worldwide from 2005 to 2023, by region (in millions)
Number of travel and tourism jobs worldwide from 2019 to 2022, with a forecast for 2023 and 2033 (in millions)
- Premium Statistic Global hotel and resort industry market size worldwide 2013-2023
- Premium Statistic Most valuable hotel brands worldwide 2023, by brand value
- Basic Statistic Leading hotel companies worldwide 2023, by number of properties
- Premium Statistic Hotel openings worldwide 2021-2024
- Premium Statistic Hotel room openings worldwide 2021-2024
- Premium Statistic Countries with the most hotel construction projects in the pipeline worldwide 2022
Global hotel and resort industry market size worldwide 2013-2023
Market size of the hotel and resort industry worldwide from 2013 to 2022, with a forecast for 2023 (in trillion U.S. dollars)
Most valuable hotel brands worldwide 2023, by brand value
Leading hotel brands based on brand value worldwide in 2023 (in billion U.S. dollars)
Leading hotel companies worldwide 2023, by number of properties
Leading hotel companies worldwide as of June 2023, by number of properties
Hotel openings worldwide 2021-2024
Number of hotels opened worldwide from 2021 to 2022, with a forecast for 2023 and 2024
Hotel room openings worldwide 2021-2024
Number of hotel rooms opened worldwide from 2021 to 2022, with a forecast for 2023 and 2024
Countries with the most hotel construction projects in the pipeline worldwide 2022
Countries with the highest number of hotel construction projects in the pipeline worldwide as of Q4 2022
- Premium Statistic Airports with the most international air passenger traffic worldwide 2022
- Premium Statistic Market value of selected airlines worldwide 2023
- Premium Statistic Global passenger rail users forecast 2017-2027
- Premium Statistic Daily ridership of bus rapid transit systems worldwide by region 2023
- Premium Statistic Number of users of car rentals worldwide 2019-2028
- Premium Statistic Number of users in selected countries in the Car Rentals market in 2023
- Premium Statistic Carbon footprint of international tourism transport worldwide 2005-2030, by type
Airports with the most international air passenger traffic worldwide 2022
Leading airports for international air passenger traffic in 2022 (in million international passengers)
Market value of selected airlines worldwide 2023
Market value of selected airlines worldwide as of May 2023 (in billion U.S. dollars)
Global passenger rail users forecast 2017-2027
Worldwide number of passenger rail users from 2017 to 2022, with a forecast through 2027 (in billion users)
Daily ridership of bus rapid transit systems worldwide by region 2023
Number of daily passengers using bus rapid transit (BRT) systems as of April 2023, by region
Number of users of car rentals worldwide 2019-2028
Number of users of car rentals worldwide from 2019 to 2028 (in millions)
Number of users in selected countries in the Car Rentals market in 2023
Number of users in selected countries in the Car Rentals market in 2023 (in million)
Carbon footprint of international tourism transport worldwide 2005-2030, by type
Transport-related emissions from international tourist arrivals worldwide in 2005 and 2016, with a forecast for 2030, by mode of transport (in million metric tons of carbon dioxide)
Attractions
- Premium Statistic Leading museums by highest attendance worldwide 2019-2022
- Basic Statistic Most visited amusement and theme parks worldwide 2019-2022
- Basic Statistic Monuments on the UNESCO world heritage list 2023, by type
- Basic Statistic Selected countries with the most Michelin-starred restaurants worldwide 2023
Leading museums by highest attendance worldwide 2019-2022
Most visited museums worldwide from 2019 to 2022 (in millions)
Most visited amusement and theme parks worldwide 2019-2022
Leading amusement and theme parks worldwide from 2019 to 2022, by attendance (in millions)
Monuments on the UNESCO world heritage list 2023, by type
Number of monuments on the UNESCO world heritage list as of September 2023, by type
Selected countries with the most Michelin-starred restaurants worldwide 2023
Number of Michelin-starred restaurants in selected countries and territories worldwide as of July 2023
Online travel market
- Premium Statistic Online travel market size worldwide 2017-2028
- Premium Statistic Estimated desktop vs. mobile revenue of leading OTAs worldwide 2023
- Premium Statistic Number of aggregated downloads of leading online travel agency apps worldwide 2023
- Basic Statistic Market cap of leading online travel companies worldwide 2023
- Premium Statistic Estimated EV/Revenue ratio in the online travel market 2024, by segment
- Premium Statistic Estimated EV/EBITDA ratio in the online travel market 2024, by segment
Online travel market size worldwide 2017-2028
Online travel market size worldwide from 2017 to 2023, with a forecast until 2028 (in billion U.S. dollars)
Estimated desktop vs. mobile revenue of leading OTAs worldwide 2023
Estimated desktop vs. mobile revenue of leading online travel agencies (OTAs) worldwide in 2023 (in billion U.S. dollars)
Number of aggregated downloads of leading online travel agency apps worldwide 2023
Number of aggregated downloads of selected leading online travel agency apps worldwide in 2023 (in millions)
Market cap of leading online travel companies worldwide 2023
Market cap of leading online travel companies worldwide as of September 2023 (in million U.S. dollars)
Estimated EV/Revenue ratio in the online travel market 2024, by segment
Estimated enterprise value to revenue (EV/Revenue) ratio in the online travel market worldwide as of April 2024, by segment
Estimated EV/EBITDA ratio in the online travel market 2024, by segment
Estimated enterprise value to EBITDA (EV/EBITDA) ratio in the online travel market worldwide as of April 2024, by segment
Selected trends
- Premium Statistic Global travelers who believe in the importance of green travel 2023
- Premium Statistic Sustainable initiatives travelers would adopt worldwide 2022, by region
- Premium Statistic Airbnb revenue worldwide 2017-2023
- Premium Statistic Airbnb nights and experiences booked worldwide 2017-2023
- Premium Statistic Technologies global hotels plan to implement in the next three years 2022
- Premium Statistic Hotel technologies global consumers think would improve their future stay 2022
Global travelers who believe in the importance of green travel 2023
Share of travelers that believe sustainable travel is important worldwide in 2023
Sustainable initiatives travelers would adopt worldwide 2022, by region
Main sustainable initiatives travelers are willing to adopt worldwide in 2022, by region
Airbnb revenue worldwide 2017-2023
Revenue of Airbnb worldwide from 2017 to 2023 (in billion U.S. dollars)
Airbnb nights and experiences booked worldwide 2017-2023
Nights and experiences booked with Airbnb from 2017 to 2023 (in millions)
Technologies global hotels plan to implement in the next three years 2022
Technologies hotels are most likely to implement in the next three years worldwide as of 2022
Hotel technologies global consumers think would improve their future stay 2022
Must-have hotel technologies to create a more amazing stay in the future among travelers worldwide as of 2022
- Premium Statistic Travel and tourism revenue worldwide 2019-2028, by segment
- Premium Statistic Distribution of sales channels in the travel and tourism market worldwide 2018-2028
- Premium Statistic Inbound tourism visitor growth worldwide 2020-2025, by region
- Premium Statistic Outbound tourism visitor growth worldwide 2020-2025, by region
Travel and tourism revenue worldwide 2019-2028, by segment
Revenue of the global travel and tourism market from 2019 to 2028, by segment (in billion U.S. dollars)
Distribution of sales channels in the travel and tourism market worldwide 2018-2028
Revenue share of sales channels of the travel and tourism market worldwide from 2018 to 2028
Inbound tourism visitor growth worldwide 2020-2025, by region
Inbound tourism visitor growth worldwide from 2020 to 2022, with a forecast until 2025, by region
Outbound tourism visitor growth worldwide 2020-2025, by region
Outbound tourism visitor growth worldwide from 2020 to 2022, with a forecast until 2025, by region
Further reports
Get the best reports to understand your industry.
Mon - Fri, 9am - 6pm (EST)
Mon - Fri, 9am - 5pm (SGT)
Mon - Fri, 10:00am - 6:00pm (JST)
Mon - Fri, 9:30am - 5pm (GMT)
- KSAT Insider
- KSAT Connect
- Entertainment
WEATHER ALERT
3 advisories in effect for 23 regions in the area
San antonio international adds 3 nonstop flights amid record-breaking number of passengers, nonstop flights going to torreon, burbank and philadelphia.
Ivan Herrera , Digital Journalist
SAN ANTONIO – The San Antonio International Airport (SAT) is adding three new nonstop flights in June amid a record-breaking number of passengers for the year.
SAT reported its 12th record-breaking month in a row for April 2024, with a 7% increase in passengers compared to April 2023.
Recommended Videos
“More people are flying than ever before – and we’re constantly working on adding even more destinations to meet that demand,” said Jacob Tyler, chief air service development officer for the City of San Antonio’s Aviation Department. “April 2024 was the first time we’ve surpassed 900,000 passengers for the month of April.”
New nonstop flights
Three new flights are launching this month, two domestic and one international. They launch as follows:
- June 1: Viva Aerobus to Torreon (Tuesdays and Saturdays)
- June 4: Southwest Airlines to Burbank (daily)
- June 5: American Airlines to Philadelphia (daily)
“These new destinations are important to both our business and leisure travelers,” said Jesus H. Saenz, Jr., director of airports for the Aviation Department.
SAT said the following airlines had the largest increases in service year over year:
- Spirit Airlines
- Alaska Airlines
- Delta Air Lines
- Viva Aerobus
- American Airlines
- Southwest Airlines
Find more details on the airport’s 45 nonstop destinations here .
Copyright 2024 by KSAT - All rights reserved.
About the Author
Ivan herrera.
Ivan Herrera has worked as a journalist in San Antonio since 2016. His work for KSAT 12 and KSAT.com includes covering breaking news of the day, as well as producing Q&As and content for the "South Texas Pride" and "KSAT Money" series.
ORIGINAL RESEARCH article
This article is part of the research topic.
Transactional and Transnational Contact within World Englishes: The Gulf Region and Beyond
"How can I get into the city center?" -Pragmatic strategies at use in international tourism interactions in Croatia Provisionally Accepted

- 1 Technical University Dortmund, Germany
- 2 University of Cologne, Germany
The final, formatted version of the article will be published soon.
In Croatia, speaking many different languages is popular and perceived as a prestigious abilityskill. English is one of the most commonly spoken additional languages and many Croats engage with it frequently, e.g. when watching undubbed American or British TV programs and movies. Due to this frequent engagement as well as the rise of English as a global language, especially younger Croats and those who work in the tourism sector tend to be quite proficient users of English. Similar to other lingua franca contexts, wWhen interacting with tourists, Croats use accommodation strategies to cater to the tourists' linguistic needs to increase understanding and communicative success (cf., e.g., Kaur 2022 on pragmatic strategies). The present investigation centers on the specific pragmatic strategies present in such interactions between international tourists and local tourism workers and, based on a subset of 48 conversations recorded at the Franjo Tuđman Airport Zagreb, it illustrates the pragmatic strategies in the relational negotiation of directions to the city center. It shows that tourists and tourism workers tend to use the investigated pragmatic strategies in the following order of frequency: SMs>DMs>HMS>repetition>rephrasing>other features. However, taking a closer look, the study unveils how tourism workers balance the need for efficiency and sociability when engaging with international tourists and offers a first take at understanding why the answers to similar questions often vary and that shows that the quality and quantity of the provided answers are influenced not only by linguistic factors.
Keywords: Elf1, Croatia2, English in Tourism3, pragmatic strategies4, international communication5
Received: 26 Mar 2024; Accepted: 03 Jun 2024.
Copyright: © 2024 Vida-Mannl. This is an open-access article distributed under the terms of the Creative Commons Attribution License (CC BY) . The use, distribution or reproduction in other forums is permitted, provided the original author(s) or licensor are credited and that the original publication in this journal is cited, in accordance with accepted academic practice. No use, distribution or reproduction is permitted which does not comply with these terms.
* Correspondence: Mx. Manuela Vida-Mannl, Technical University Dortmund, Dortmund, Germany
People also looked at
IMAGES
COMMENTS
As tourism slowly restarts in an increasing number of countries, the World Tourism Organization (UN Tourism) has developed the first comprehensive tourism recovery tracker worldwide, monitoring a number of relevant indicators throughout the recovery of tourism. ... Export revenues from international tourism dropped 62% in 2020 and 59% in 2021 ...
Tourism has massively increased in recent decades. Aviation has opened up travel from domestic to international. Before the COVID-19 pandemic, the number of international visits had more than doubled since 2000. Tourism can be important for both the travelers and the people in the countries they visit. For visitors, traveling can increase their ...
Number of international tourist arrivals worldwide 1950-2023. Published by Statista Research Department , May 6, 2024. The number of international tourist arrivals worldwide increased in 2023 ...
Tourism Statistics. Get the latest and most up-to-date tourism statistics for all the countries and regions around the world. Data on inbound, domestic and outbound tourism is available, as well as on tourism industries, employment and complementary indicators. All statistical tables available are displayed and can be accessed individually ...
International tourism, number of arrivals. World Tourism Organization, Yearbook of Tourism Statistics, Compendium of Tourism Statistics and data files. License : CC BY-4.0. LineBarMap. Share Details. Label. 1995 - 2020.
According to the first UNWTO World Tourism Barometer of the year, international tourism ended 2023 at 88% of pre-pandemic levels, with an estimated 1.3 billion international arrivals.The unleashing of remaining pent-up demand, increased air connectivity, and a stronger recovery of Asian markets and destinations, are expected to underpin a full recovery by the end of 2024 (UNWTO Tourism ...
International tourism up 4% in 2021 but still 72% below pre-pandemic levels Global tourism experienced a mild 4% upturn in 2021, with 15 million more international tourist arrivals (overnight visitors) than in 2020 but remained 72% below the levels of pre-pandemic year 2019 according to preliminary estimates. This follows a 73% plunge in international travel in 2020, the worst year on record ...
International tourism on track to reach 65% of pre-pandemic levels by the end of 2022 International tourism showed robust performance in January-September 2022, with arrivals reaching 63% of pre-pandemic levels in the first nine months of 2022. An estimated 700 million tourists travelled internationally between January and September, more than double (+133%) the number recorded in the same ...
This chart shows international tourist arrivals worldwide since 1990. ... Since 1980, the number of international arrivals skyrocketed from 277 million to nearly 1.5 billion in 2019. As our chart ...
Number of international tourist arrivals worldwide from 2005 to 2023, by region (in millions) [Graph], World Tourism Organization (UN Tourism), May 2, 2024. [Online].
The World Tourism rankings are compiled by the United Nations World Tourism Organization as part of their World Tourism Barometer publication, which is released up to six times per year. In the publication, destinations are ranked by the number of international visitor arrivals, by the revenue generated by inbound tourism, and by the ...
Fatalities from airliner accidents and hijackings. Foreign guests in hotels and similar establishments. Global aviation fatalities per million passengers. International one-day trips. International one-day trips per 1,000 people. International tourist departures. International tourist departures per 1,000 people.
6 International Tourism ighlights - 2023 Edition (Revised and updated, October 2023) • International tourism experienced a 13% increase in 2021 to reach 458 million arrivals, 51 million more than in 2020, but still 69% less than the pre-pandemic levels of 2019 (1,464 million). • Export revenues from international tourism also
international tourist arrivals are expected to reach pre-pandemic levels in 2024, reaching 88% of the 2019 level in 2023,1 while at $9.9 trillion, T&T's ... move away from just increasing visitor numbers and promoting tourism to destination stewardship.18 Even before the pandemic, DMOs were increasingly focusing on managing visitor flows ...
International tourism is expected to rise back up to pre-pandemic levels in 2024. Meanwhile, recovery for the global travel industry continues to be uneven. The travel and tourism industry was hit hard by the pandemic. Pent-up demand is driving up passenger numbers again - but the recovery across economies hasn't been even. Here's what ...
For 2024, six countries share the number one ranking - France, Germany, Italy, Japan, Singapore and Spain. Five of those nations appear in the WEF's top 10, with Singapore a respectable 13th ...
Countries with the highest number of international tourist arrivals worldwide from 2019 to 2022 (in millions) [Graph], World Tourism Organization (UN Tourism), November 29, 2023. [Online].
After falling by 75 percent in 2020, travel is on its way to a full recovery by the end of 2024. Domestic travel is expected to grow 3 percent annually and reach 19 billion lodging nights per year by 2030. 1 Unless otherwise noted, the source for all data and projections is Oxford Economics. Over the same time frame, international travel should likewise ramp up to its historical average of ...
Jun 03, 2024 | Aon. As summer approaches, consumers are eagerly mapping out their vacation plans, as evidenced by these statistics from Pinterest: over one billion travel-related searches and more than 10 billion travel saves in the past year alone. International travel in 2023 rebounded to 88% of pre-pandemic levels, signaling a promising path ...
Post-Covid travel rebound. Queensland tourist numbers have rebounded since the state opened its borders after the pandemic, with most international visitors from New Zealand and the United Kingdom.
As such, international tourism can generate a tourism trade surplus when receipts exceed expenditure, or a deficit (vice versa) in the travel balance of countries. In 2019, the United States of America had the world's largest travel surplus with USD 62 billion, resulting from tourism receipts of USD 214 billion and expenditure of USD 152 billion.
Services exports grew by 1.6% in Q1 2024 in the United States, due to higher receipts from travel and financial services, while imports rose sharply (up 4.1%), driven by travel, transport, and financial services. In Canada, services exports stagnated while imports rose by 1.3%. Driven by lower receipts from financial and other business services ...
Number of international tourist arrivals worldwide from 2005 to 2023, by region (in millions) Basic Statistic Travel and tourism employment worldwide 2019-2033
SAN ANTONIO - The San Antonio International Airport (SAT) is adding three new nonstop flights in June amid a record-breaking number of passengers for the year. SAT reported its 12th record ...
The present investigation centers on the specific pragmatic strategies present in such interactions between international tourists and local tourism workers and, based on a subset of 48 conversations recorded at the Franjo Tuđman Airport Zagreb, it illustrates the pragmatic strategies in the relational negotiation of directions to the city center.